Insight Dude
Decision-ready reports from your spreadsheet
I'm your analyst-in-a-box — upload CSV or Excel and get what changed, what drove it, and what to do next.

KPI Report
For operators who need a fast MTD/YTD readout — trend cards and a clean PDF for weekly reviews.
Start KPI Report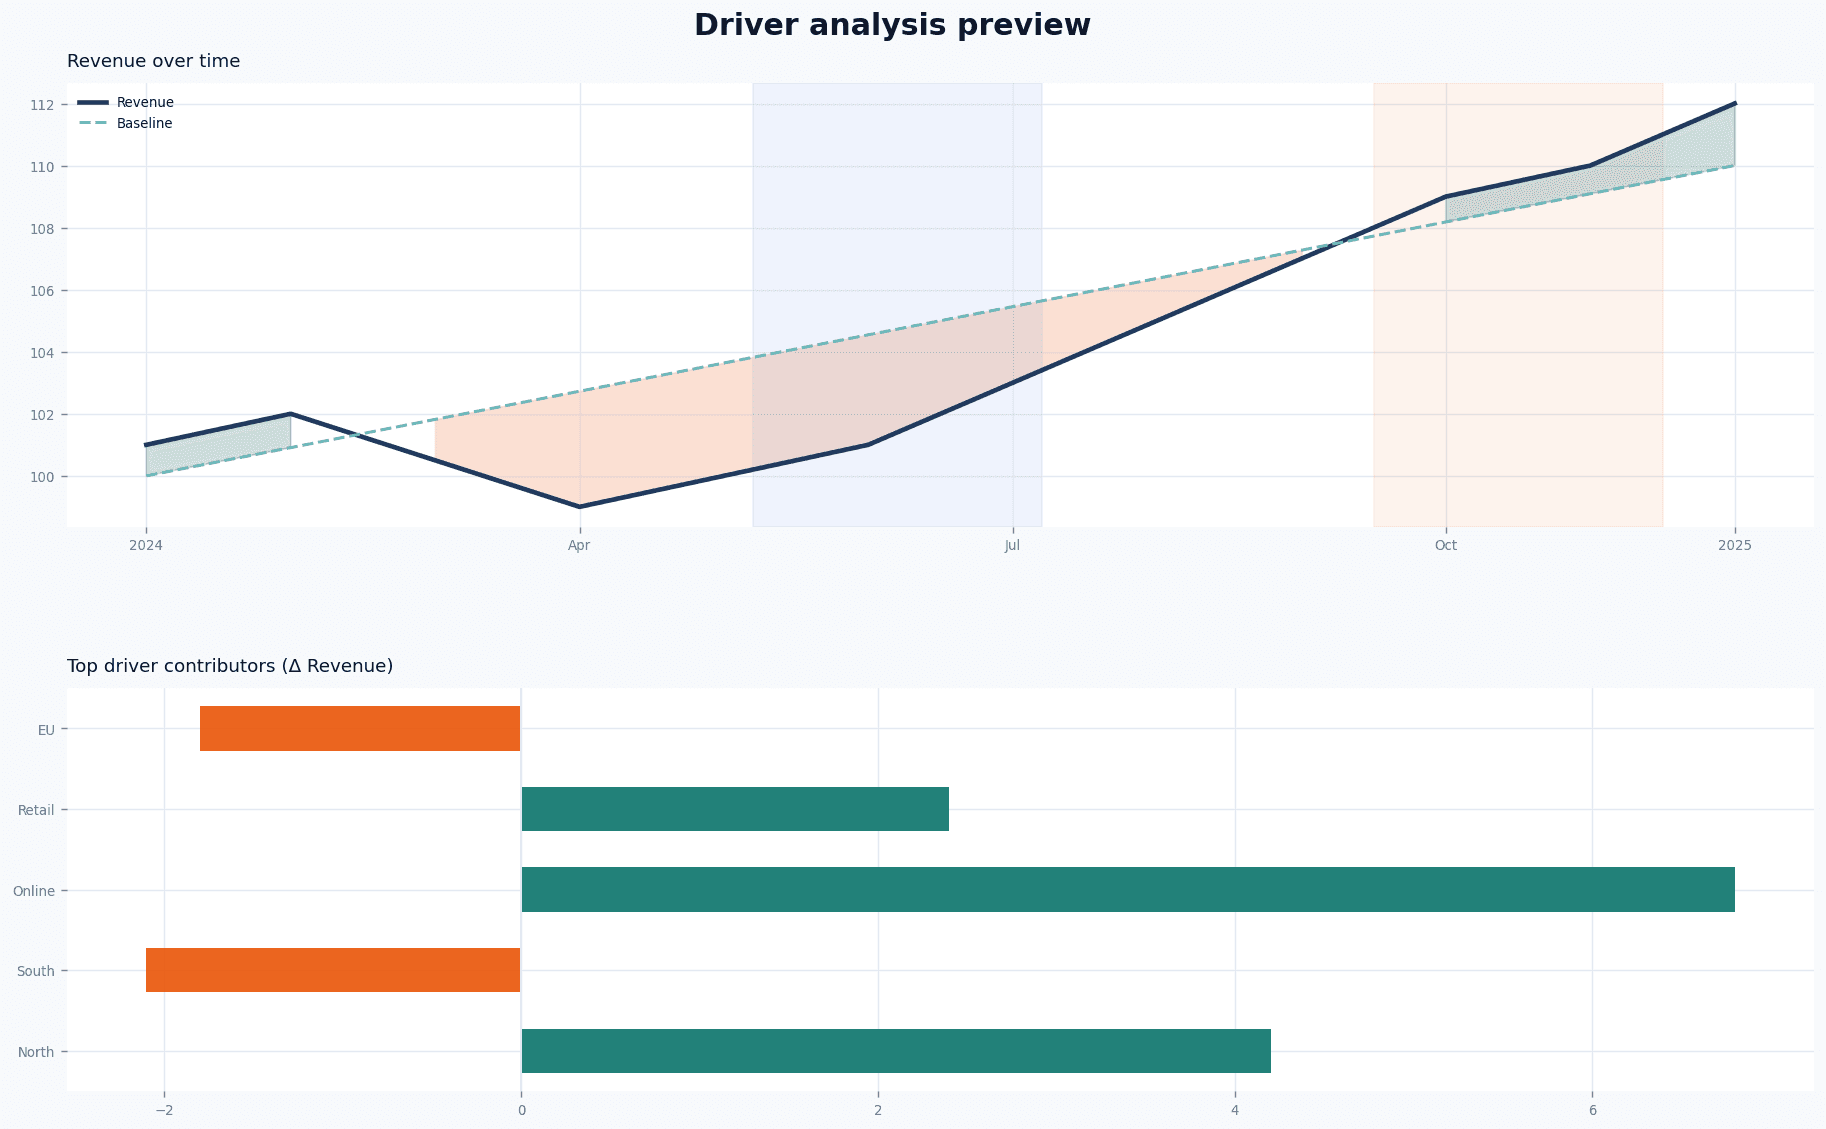
Analysis
For people who want to deeply understand what moved — structural drivers, shocks, and what to do next.
Start AnalysisWatch a 60-second demo
Add your walkthrough video here (Vercel-friendly embed). This section is a placeholder you can replace anytime.
About Insight Dude
Insight Dude is your virtual data analyst: fast, structured, and decision-oriented. Pick KPI Report or Analysis, upload a spreadsheet, and get a PDF you can use immediately.
How you get a report
- Choose a product — KPI Report or Analysis.
- Upload CSV/XLSX. Scanning runs automatically — no extra button.
- Preview & checkout — review detected columns, pick a tier, and confirm KPI on Analysis Basic only.
- Pay & download your PDF via Stripe.
KPI Report vs Analysis
- KPI Report — MTD/YTD scorecard and trend snapshot. Basic or Advanced tier; no KPI picker.
- Analysis — driver analysis, structural & shock windows, recommendations. Basic (one KPI) or Comprehensive (multi-KPI).
What automatic scan does
- Find likely KPI columns (e.g., revenue, units, cost).
- Detect time‑series vs mixed vs cross‑sectional.
- Recommend a safe KPI if it’s ambiguous (Activity / record count).
Who it’s for
Founders, operators, consultants, and analysts who need answers quickly — especially right before a meeting.
What it does
Turns raw performance data into a structured memo: trend assessment, what changed, who drove it, what risks to watch, and what to do next.
- Trend assessment with statistical support (not just a chart)
- Driver analysis (“who moved the KPI”) when dimensions exist
- Structural and shock windows to separate lasting change vs noise
- Decision snapshot first, then detailed pages for auditability
- Exportable PDF with a consistent executive structure
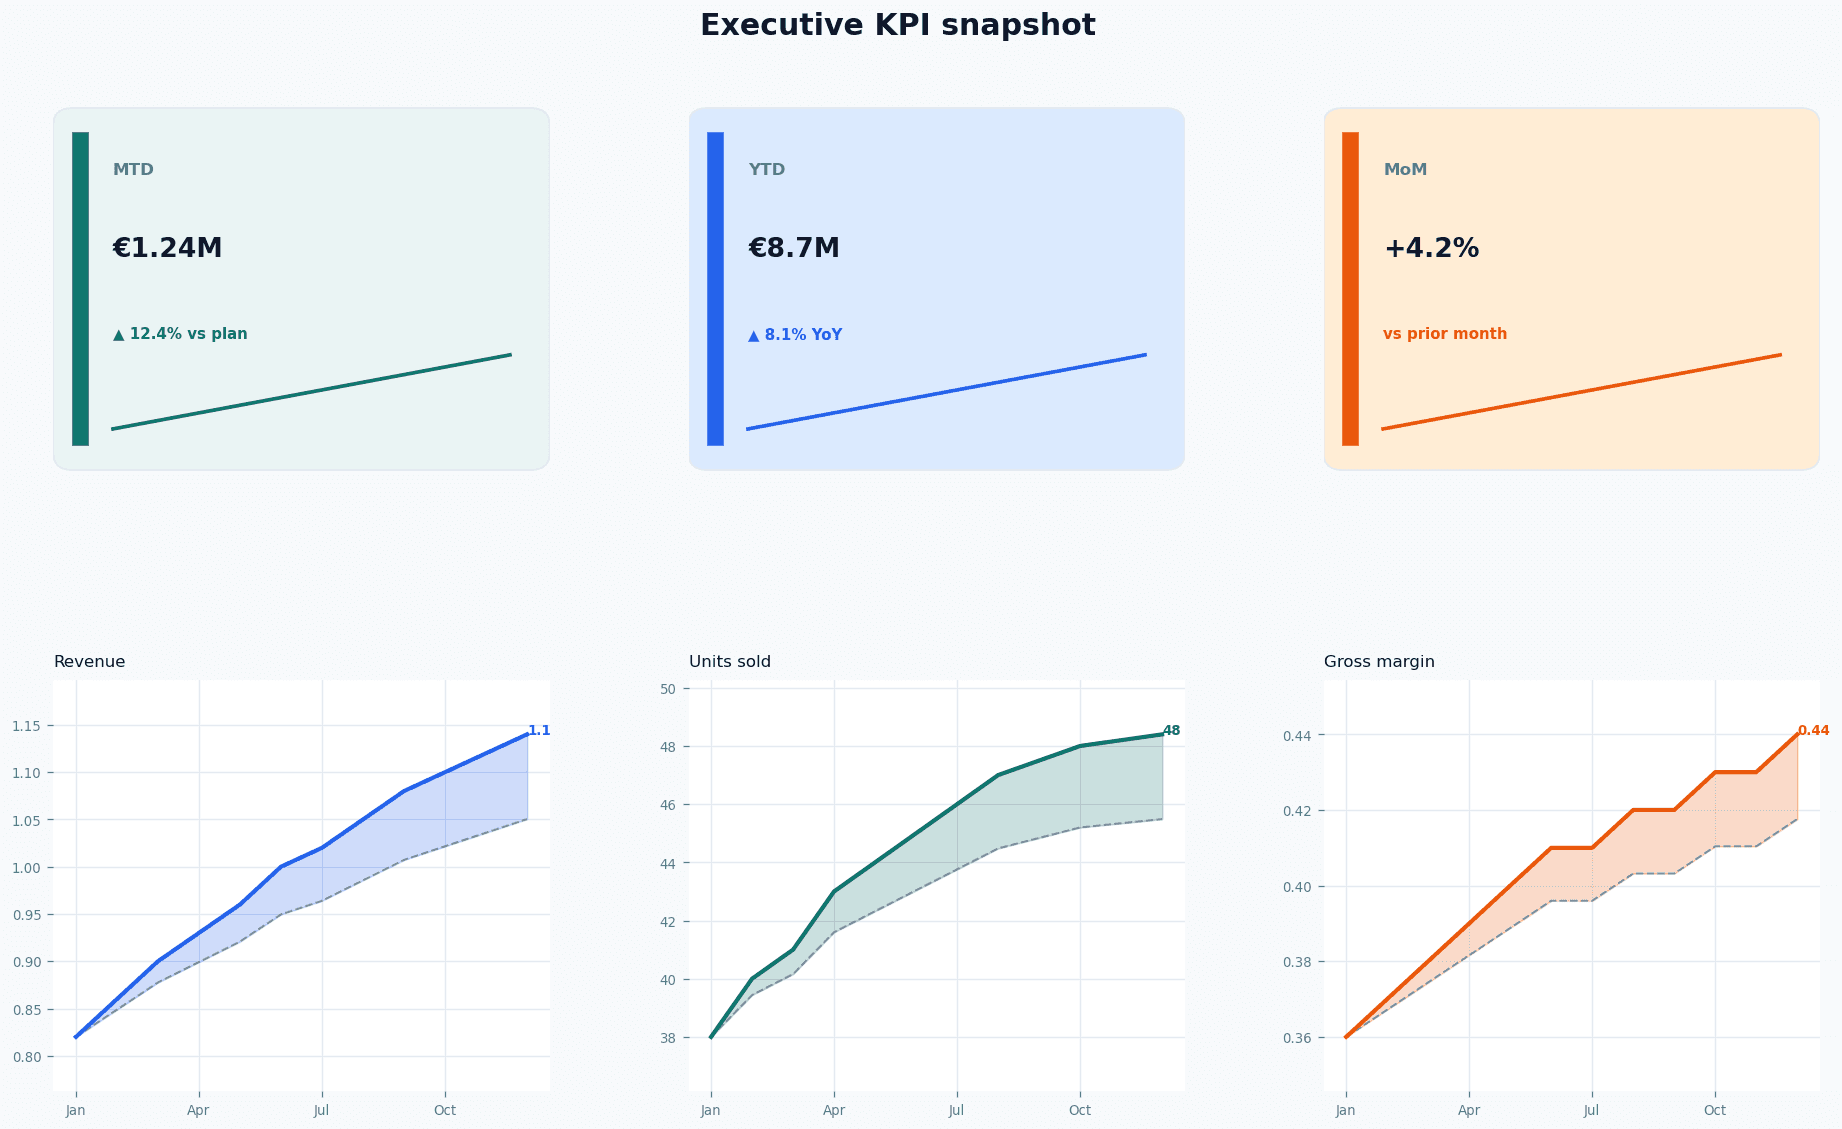
Sample output (PDF preview)
Real sample reports for each product and tier — same structure you get after checkout.
KPI Report — Basic — Single-KPI scorecard with MTD/YTD trend snapshot. Open PDF
FAQ
Who is this for?
Operators, founders, and analysts who need a clean summary of performance fast — what changed, what drove it, and what to do next — without building a dashboard.
What types of data work best?
Best: time series with a date/time column and one or more numeric KPIs (revenue, units, cost, weight, duration), optionally with dimensions (country, city, team, carrier, segment). Cross-sectional datasets (no date) are supported via segmentation summaries.
How does it work?
Choose KPI Report or Analysis, upload your file, and we scan it automatically. Preview detected KPIs and columns, pick your tier, pay via Stripe, and download a decision-ready PDF.
What steps do I need to do?
1) Pick KPI Report or Analysis. 2) Upload CSV/XLSX — scanning runs automatically. 3) Review the preview. 4) Enter email, select your tier, and confirm KPI (Analysis Basic only). 5) Pay with Stripe and download your PDF. See the demo video above for a walkthrough.
Is the report computed, or just text?
The report is grounded in computations (baselines, deltas, drivers, windows) and then written as a clear narrative so a business leader can act. It does not invent causes: any uncertainty is labeled as a hypothesis.
Can you give an example of correct data in CSV and Excel?
A good file has a header row, one date/time column, one or more numeric KPI columns (e.g., revenue, units, cost), and optional dimensions (e.g., country, city, salesperson). For Excel, put headers in cell A1 and use a single clean sheet.
What should I take care of in Excel format?
Use raw values (avoid formulas-heavy sheets), avoid merged cells, keep the table starting at A1, and keep the main dataset in the first sheet.
What if my report was not generated and I paid for it?
Stay on the product page after payment — generation usually completes within a minute. If it still fails, contact support with your email and timestamp and we'll fix it or refund you if the report can't be generated. Email: support@insightdude.com.
What should I avoid?
Avoid files with no usable numeric KPI, or with IDs only. If your dataset is logs/operations, start with Activity (number of records) or a clear KPI like latency, duration, bytes, weight, or cost.
Is my data stored?
We do not store your raw uploaded file as a dataset. We generate a PDF report and keep it temporarily so you can download it. If you enter an email, it is stored for product communications.