Marketing KPI Report: Framework and Template
Build marketing KPI reports that actually drive decisions. Learn which metrics to track, how to set benchmarks, and get ready-to-use templates for general marketing and social media reporting.
Quick Verdict
A marketing KPI report is a structured document that tracks key performance indicators—the critical metrics that measure campaign success and progress toward business goals. It’s the difference between drowning in analytics dashboards and actually knowing what’s working.
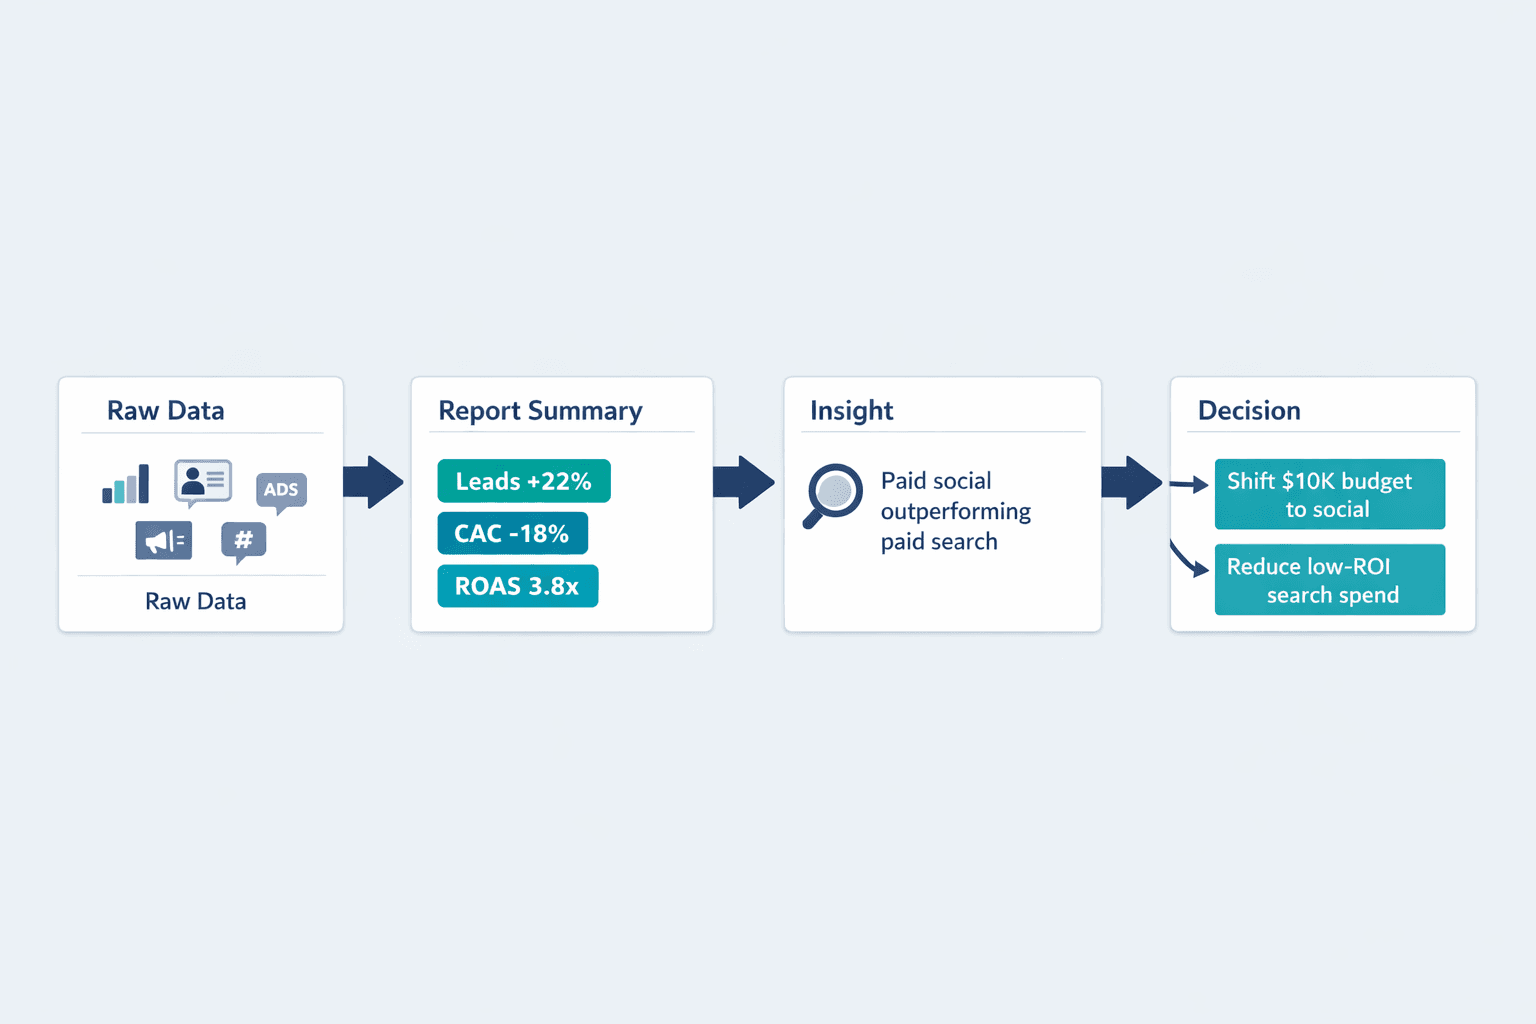
Marketing teams use KPI reports to prove ROI, justify budget decisions, and spot problems before they become expensive. When a CMO asks “Did that campaign work?”—that’s what the KPI report answers. It translates raw data into decisions: double down on this channel, kill that campaign, shift budget here.
This guide covers everything you need to build effective marketing KPI reports—from selecting the right metrics and establishing benchmarks to creating templates for general marketing and social media reporting. You’ll also learn best practices that make reports useful instead of overwhelming.
What Is a Marketing KPI Report?
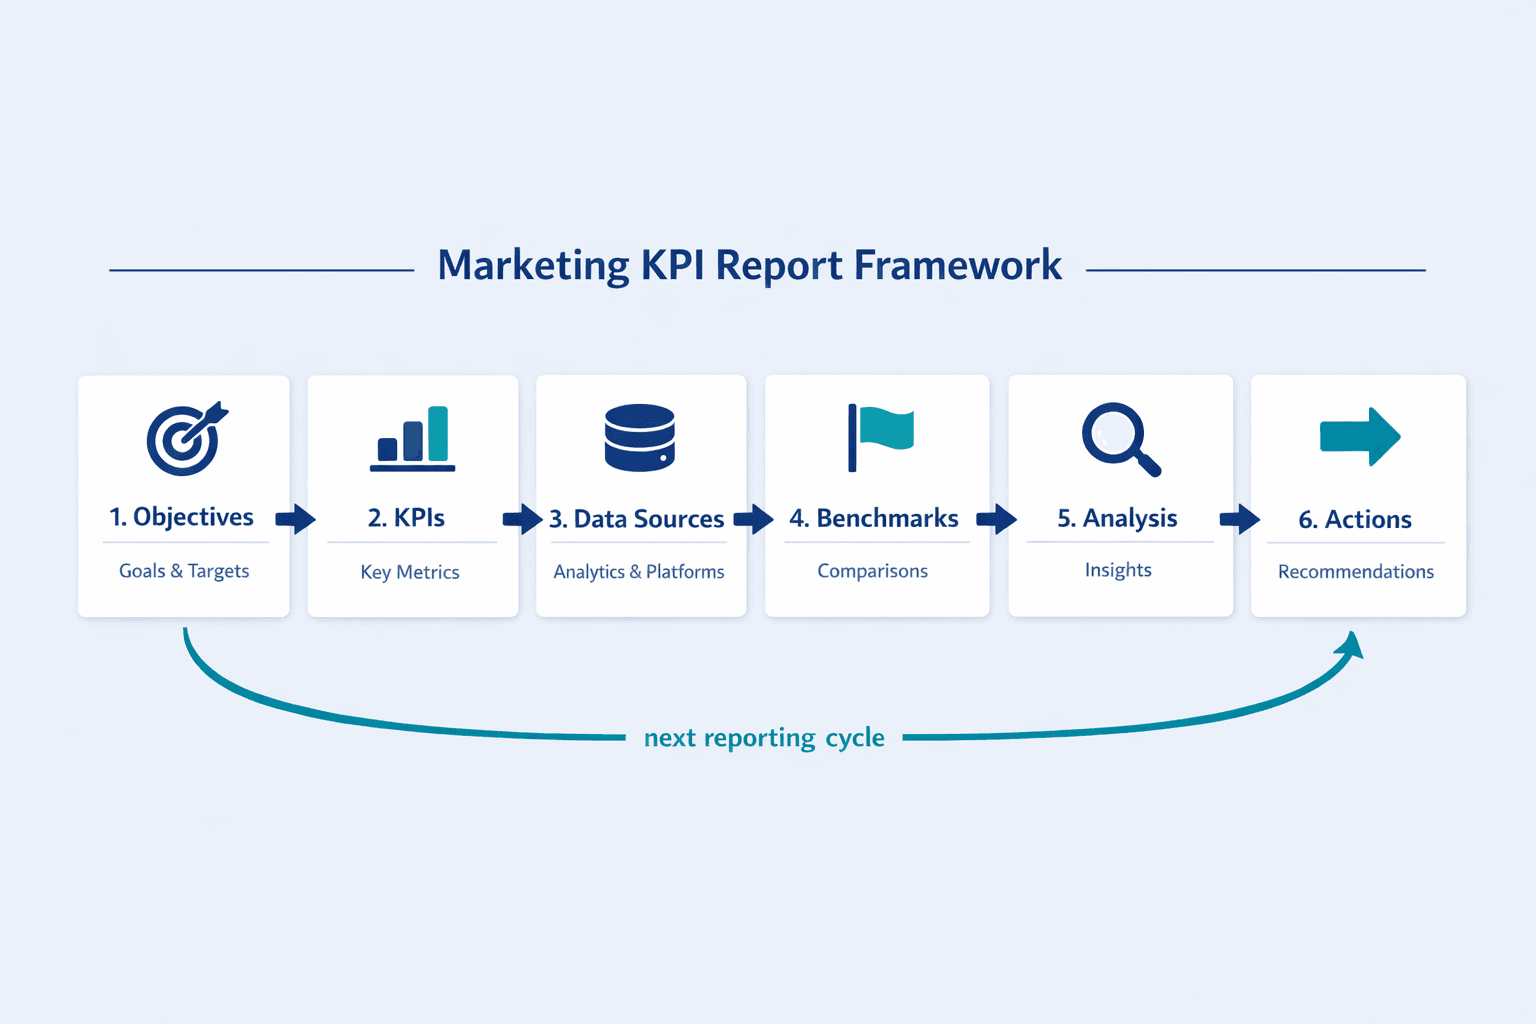
A marketing KPI report is a recurring document that tracks selected performance indicators against targets and objectives. It’s not every metric your tools can measure—it’s the handful of metrics that actually matter to your business goals.
The core components that make up a marketing KPI report include:
- Metrics selection - The 5-10 KPIs aligned with current business objectives
- Data sources - Where the numbers come from (Google Analytics, CRM, social platforms, email tools)
- Reporting period - The timeframe being measured (weekly, monthly, quarterly)
- Benchmarks - Context from past performance, industry averages, or competitor data
- Performance analysis - Explaining what changed and why it matters
- Actionable insights - Specific recommendations based on the data
The distinction between KPI reports and general analytics dashboards is focus. Dashboards show all available data—useful for exploration. KPI reports show strategic metrics tied to decisions—useful for action.
Key Elements Every Marketing KPI Report Should Include
Every effective marketing KPI report contains these essential elements:
- Executive summary - Top 3-5 metrics, biggest wins, critical challenges, immediate next steps
- Metric definitions - Clear explanations of what each KPI means and how it’s calculated
- Current vs. target performance - Where you are versus where you need to be
- Trend analysis - How performance is changing over time (week-over-week, month-over-month, year-over-year)
- Channel breakdown - Performance by marketing channel (organic search, paid ads, social, email)
- Campaign-specific results - Deep dives on active or recently completed initiatives
- Actionable insights - Data-driven recommendations stakeholders can act on
- Next steps - Concrete actions planned for the next reporting period
Marketing Data Reporting: Essential Metrics to Track
Marketing data reporting is the practice of collecting, analyzing, and presenting marketing performance data in a structured way. It’s how you turn tool outputs into business intelligence.
Different business objectives require different metric categories. An awareness campaign tracks reach and impressions. A lead generation campaign tracks conversion rate and cost per acquisition. A retention initiative tracks customer lifetime value and churn rate.
Performance Metrics by Marketing Objective
| Marketing Objective | Primary Metrics |
|---|---|
| Awareness | Reach, impressions, share of voice, branded search volume |
| Engagement | Engagement rate, time on site, pages per session, video completion rate |
| Conversion | Conversion rate, cost per conversion, lead volume, form completion rate |
| Retention | Customer retention rate, repeat purchase rate, churn rate, NPS score |
| Revenue | Marketing ROI, customer lifetime value (CLV), customer acquisition cost (CAC), return on ad spend (ROAS) |
Data Sources for Marketing Reports
Common data sources for marketing KPI reports include:
- Google Analytics - Website traffic, engaged sessions, user behavior, conversion tracking
- CRM platforms - Lead data, deal pipeline, customer information, sales attribution
- Social media analytics - Platform-native insights from Facebook, Instagram, LinkedIn, TikTok, X
- Email marketing tools - Open rates, click rates, delivery metrics, subscriber behavior
- Paid ad platforms - Google Ads, Meta Ads Manager, LinkedIn Campaign Manager for spend and ROAS data
- Search Console - Organic search performance—clicks, impressions, CTR, position
- Attribution software - Multi-touch attribution models connecting marketing touches to revenue
- Customer surveys - NPS scores, satisfaction ratings, qualitative feedback
- Marketing automation tools - Campaign performance, lead scoring, customer journey data
Data integration challenges are real—most teams pull from 5-10 different platforms. Centralized reporting matters because manual data assembly wastes time and introduces errors.
How to Create a Marketing KPI Report
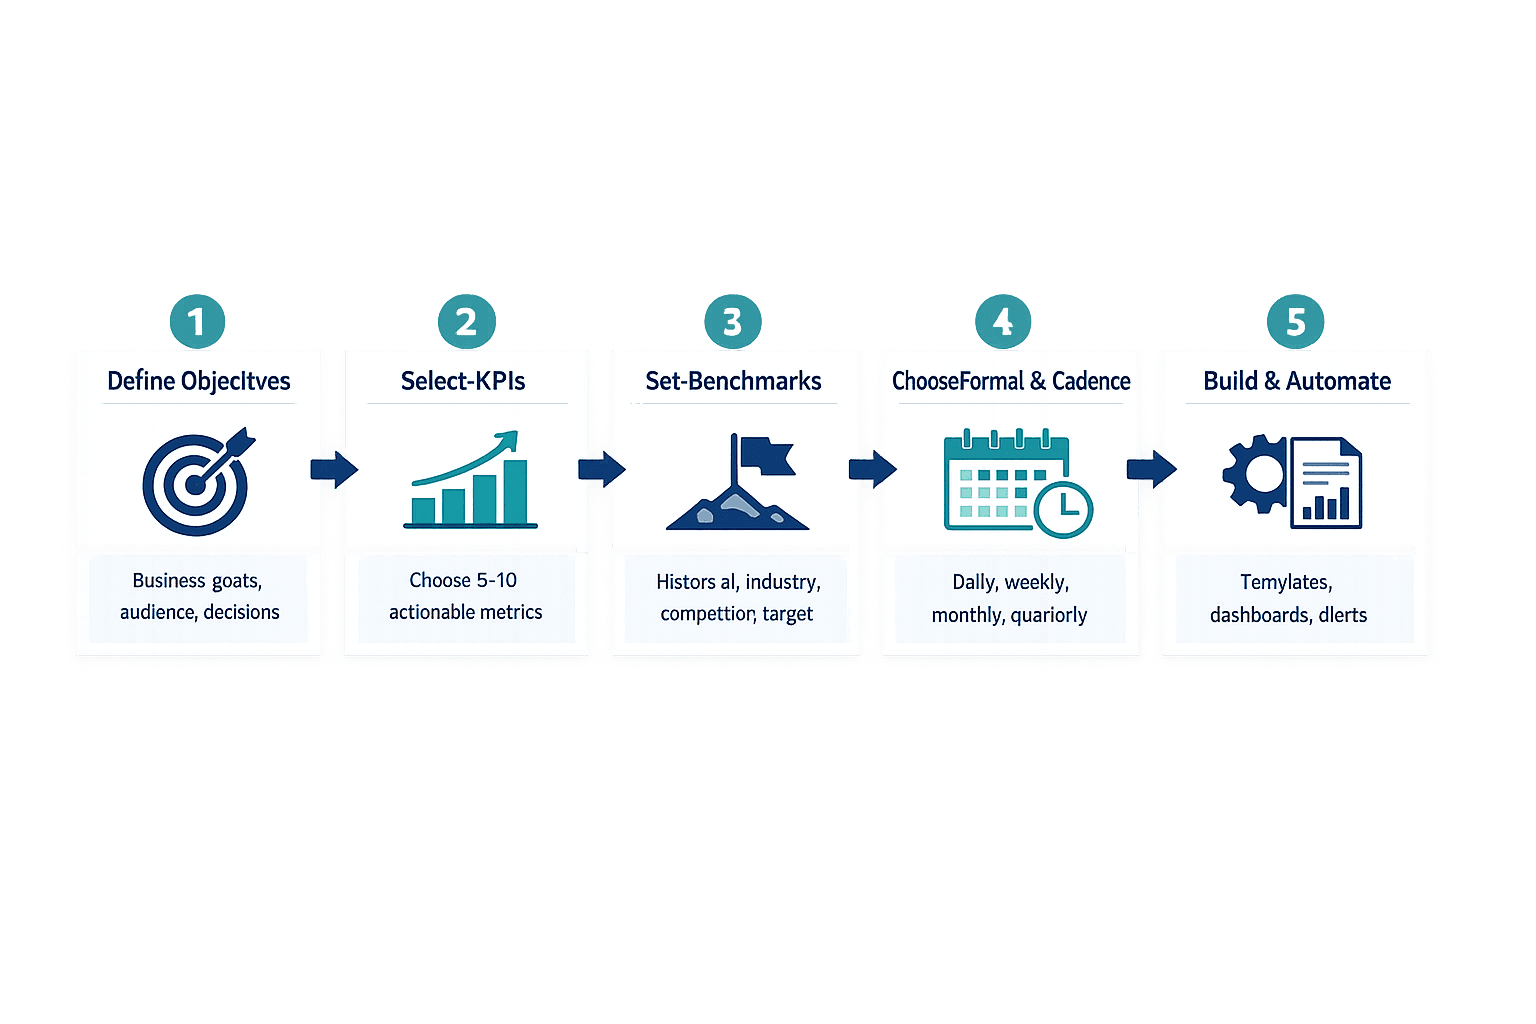
Building an effective KPI report from scratch follows a five-step process: define objectives, select KPIs, establish benchmarks, choose format and frequency, then build and automate.
Step 1: Define Your Marketing Objectives
Before choosing metrics, align on what success looks like. Stakeholder misalignment is the leading challenge in measuring digital advertising ROI—start by getting everyone on the same page.
Ask these questions when defining objectives:
- What business outcome matters most right now? - Revenue growth, market expansion, customer retention, brand awareness
- Who needs this report? - Executive leadership, marketing team, campaign managers, sales leadership
- What decisions will this report inform? - Budget allocation, campaign continuation, channel prioritization, resource planning
- What’s the reporting frequency? - Weekly for fast-moving campaigns, monthly for standard performance tracking, quarterly for strategic reviews
- What timeframe are we measuring? - Current month, quarter, year-to-date, rolling 12 months
Step 2: Select Relevant KPIs
Choose 5-10 KPIs that directly measure progress toward your defined objectives. More than that and you’re building a dashboard, not a decision tool.
Criteria for selecting KPIs:
- Measurable - You can track it consistently with available tools
- Actionable - The metric can be influenced by marketing activities
- Relevant to goals - It maps directly to a stated business objective
- Realistic to track - Data quality is reliable and collection is sustainable
- Time-bound - You can measure changes within your reporting period
- Understood by stakeholders - People know what the metric means without extensive explanation
For example, engaged sessions—sessions lasting 10+ seconds, with a key event, or with 2+ page views—is measurable, actionable, and clearly defined. “Engagement” without a formula isn’t.
Step 3: Establish Benchmarks and Targets
Raw numbers mean nothing without context. A 5% email open rate could be excellent or terrible depending on your industry and historical performance.
Benchmark sources include:
- Historical performance - Your own previous months/quarters/years
- Industry standards - Published benchmarks from platforms or research firms
- Competitor analysis - Public data or competitive intelligence where available
- Platform averages - Mailchimp’s email benchmarks or TikTok’s industry comparisons
- Business growth targets - Top-down goals from leadership or strategic plans
Step 4: Choose Reporting Format and Frequency
Different audiences need different report formats. Executives want summaries. Channel owners want detailed dashboards. Campaign managers need real-time monitoring.
| Report Frequency | Use Cases | Typical Audiences | Metric Focus |
|---|---|---|---|
| Daily | Campaign monitoring, crisis response, product launches | Campaign managers, social media teams | Real-time metrics, anomaly detection |
| Weekly | Fast-moving channels, A/B tests, tactical adjustments | Marketing team, channel owners | Engagement, spend, immediate conversions |
| Monthly | Standard performance tracking, budget reviews | Marketing leadership, executives | ROI, pipeline, goal progress |
| Quarterly | Strategic planning, board reporting, annual reviews | C-suite, board members, investors | Revenue impact, market position, long-term trends |
Most teams run monthly KPI reports as the standard cadence, with weekly reports for active campaigns and quarterly reports for leadership.
Step 5: Build and Automate Your Report
Once you know what to measure and how often, build the reporting structure. Manual reporting works at first but doesn’t scale—automation saves time and reduces errors.
Tools and methods for building and automating reports:
- Spreadsheet templates - Google Sheets or Excel with linked data sources
- Business intelligence platforms - Looker Studio, Power BI, Tableau for scheduled report delivery
- Marketing automation tools - HubSpot, Marketo, or Salesforce with built-in reporting
- Custom dashboards - Connected to APIs for real-time data refresh
- Scheduled reporting - Automated PDF delivery or email subscriptions
- Alert systems - Threshold-based notifications when metrics hit critical levels
Marketing KPI Report Template
A standard template structure works across most marketing functions. Customize sections based on your channels, objectives, and stakeholder needs.
Template Structure
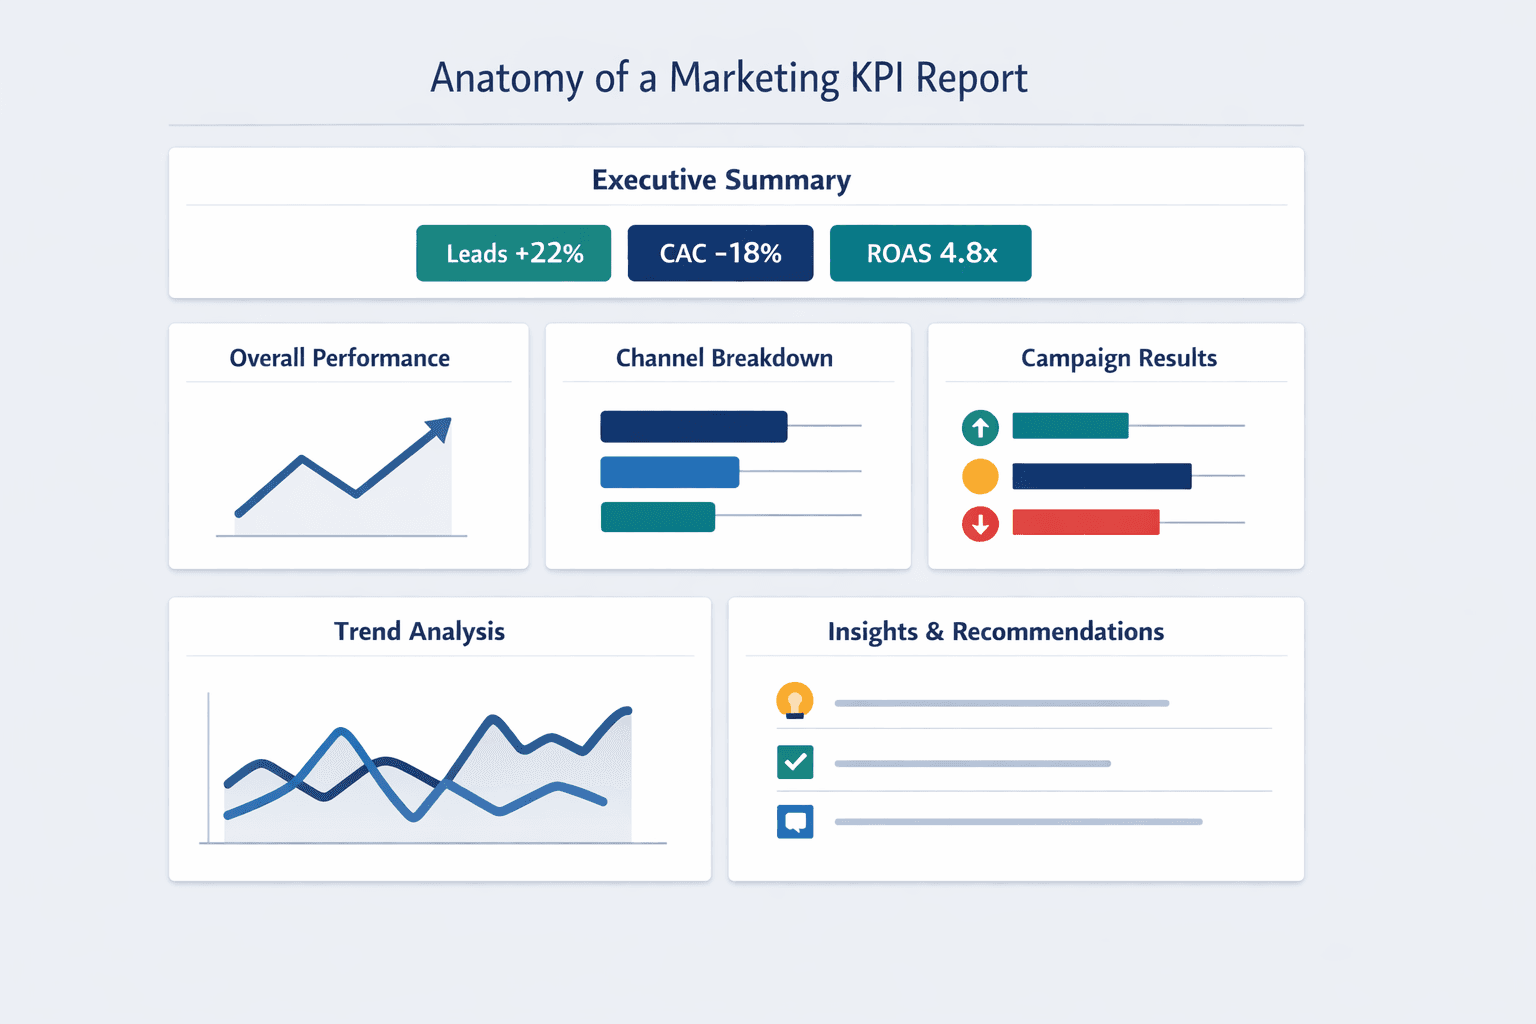
Comprehensive marketing KPI reports typically include six to seven standard sections: executive summary, overall marketing performance, channel breakdown, campaign results, trend analysis, and insights with recommendations.
Executive Summary
The executive summary delivers headline metrics, biggest wins, key challenges, and immediate actions needed—everything a busy stakeholder needs in 30 seconds.
Include these elements in the executive summary:
- Reporting period - “March 2026 Performance” or “Q1 2026 Results”
- Top 3 metrics - The numbers that matter most this period (e.g., leads +22%, CAC down 18%, ROAS 4.8x)
- Performance vs. targets - Are you ahead or behind on key goals?
- Critical insights - One or two data-backed observations that drive decisions
- Recommendations - Specific actions needed based on performance
Overall Marketing Performance
This section shows high-level aggregate metrics before breaking down by channel or campaign.
| Metric | Current Period | Previous Period | Change % | Target | Status |
|---|---|---|---|---|---|
| Website Traffic | 52,300 sessions | 48,100 sessions | +8.7% | 50,000 | ✅ On track |
| Leads Generated | 1,240 | 1,015 | +22.2% | 1,200 | ✅ Exceeded |
| Conversion Rate | 2.37% | 2.11% | +12.3% | 2.5% | ⚠️ Close |
| Cost Per Acquisition | $87 | $106 | -17.9% | $90 | ✅ On track |
| Marketing ROI | 3.8x | 3.2x | +18.8% | 4.0x | ⚠️ Close |
Channel Performance Breakdown
Break out performance by marketing channel to identify what’s working and where to reallocate resources.
Marketing channels to include (customize based on your mix):
- Organic search - SEO-driven traffic, rankings, organic conversions
- Paid search - Google Ads, Bing Ads performance and ROAS
- Social media - Organic and paid social across active platforms
- Email marketing - Campaign performance, subscriber growth, engagement
- Content marketing - Blog traffic, content downloads, resource engagement
- Referral traffic - Partner links, backlinks, affiliate performance
- Direct traffic - Branded searches and direct URL visits
Customize this list based on your active marketing mix—don’t report on channels you’re not using.
Campaign-Specific Results
Track individual campaigns separately when they represent significant budget or strategic importance.
| Campaign Name | Objective | Budget | Key Metrics | Performance vs. Goal | ROI |
|---|---|---|---|---|---|
| Q1 Product Launch | Awareness + Leads | $45,000 | 2.1M impressions, 580 leads | 116% of lead goal | 4.2x |
| Spring Email Series | Engagement + Sales | $0 | 28% open rate, 4.2% CTR, $12,400 revenue | 89% of revenue goal | N/A (organic) |
| Paid Social - Lead Gen | Lead Volume | $18,500 | 390 leads @ $47.44 CAC | 130% of lead goal | 3.8x |
Trend Analysis
Show how performance changes over time to identify patterns, seasonality, and long-term trajectory.
Trend visualization types to include:
- Month-over-month growth - Current month vs. previous month changes
- Quarter-over-quarter comparison - Seasonal performance shifts
- Year-over-year performance - Same period last year for context
- Rolling 12-month averages - Smooth out volatility for clearer trends
- Progress toward annual goals - Where you stand on yearly targets
Insights and Recommendations
This section translates data into action. Raw numbers are useless if they don’t inform decisions.
Types of insights to include:
- Performance anomalies - Unexpected spikes or drops that need explanation
- Successful tactics to scale - What’s working better than expected
- Underperforming areas needing adjustment - Where results fall short and why
- Emerging opportunities - New channels, audiences, or approaches worth testing
- Budget reallocation suggestions - Shift spending from low-ROI to high-ROI activities
- Resource needs - Where additional headcount, tools, or support would accelerate performance
Customizing the Template
Adapt the standard template to your specific business needs, team size, and reporting audience. A five-person startup doesn’t need the same structure as a 500-person enterprise team.
Customization considerations:
- Stakeholder requirements - What decisions do they need to make with this report?
- Industry-specific metrics - B2B lead quality, e-commerce cart metrics, SaaS activation rates
- Company maturity stage - Early startups focus on growth; mature companies emphasize efficiency
- Available data sources - Report what you can reliably measure
- Reporting tools - Your BI platform capabilities and team technical skills
Social Media KPI Report Template
Social media reporting needs its own framework because platform-specific metrics don’t fit into general marketing templates cleanly.
Social media KPIs differ from broader marketing metrics—focus shifts to engagement quality, audience growth velocity, sentiment, and platform-native performance indicators like video completion rates and story drop-offs.
Essential Social Media KPIs
Core social media metrics include:
- Follower growth rate - Net new followers as a percentage of total audience
- Reach - Unique accounts seeing your content
- Impressions - Total times your content was displayed
- Engagement rate - (Likes + comments + shares) / reach × 100
- Click-through rate - Clicks to your website or landing pages / impressions
- Share of voice - Your brand mentions vs. competitor mentions in your category
- Sentiment score - Positive, neutral, and negative mention breakdown
- Response time - How quickly you respond to comments and messages (73% of consumers expect a response within 24 hours)
- Video views - Platform-specific view counts and completion rates
- Story completion rate - Percentage of viewers who watch stories to the end
- Hashtag performance - Reach and engagement by hashtag
- Influencer impact - Performance of influencer partnerships and collaborations
Platform-Specific Metrics
| Platform | Unique Metrics |
|---|---|
| Story completion rate, Reels plays, saves, profile visits, link clicks in stories | |
| TikTok | Video views, 2-second views, 6-second views, completion rate, average watch time |
| Post impressions, engagement rate, follower demographics, connection growth, content downloads | |
| X (Twitter) | Impressions, profile visits, mentions, Moments completion rate, retweets |
| Page reach, post engagement, video watch time, event responses, group activity |
Social Media Report Template Structure
Social media reports need sections that general marketing reports skip: content format analysis, audience demographics, sentiment tracking, and competitor benchmarking.
Social Media Executive Summary
The social media executive summary foregrounds platform reach, overall engagement, follower trajectory, top content, wins, and improvement areas.
Summary elements to include:
- Total reach across platforms - Unique accounts reached this period
- Overall engagement rate - Aggregate engagement across all active platforms
- Follower growth - Net new followers and growth rate
- Top-performing content - Best post by reach or engagement
- Key wins - Campaigns that exceeded expectations or achieved viral reach
- Areas for improvement - Platforms or content types underperforming
Platform Performance
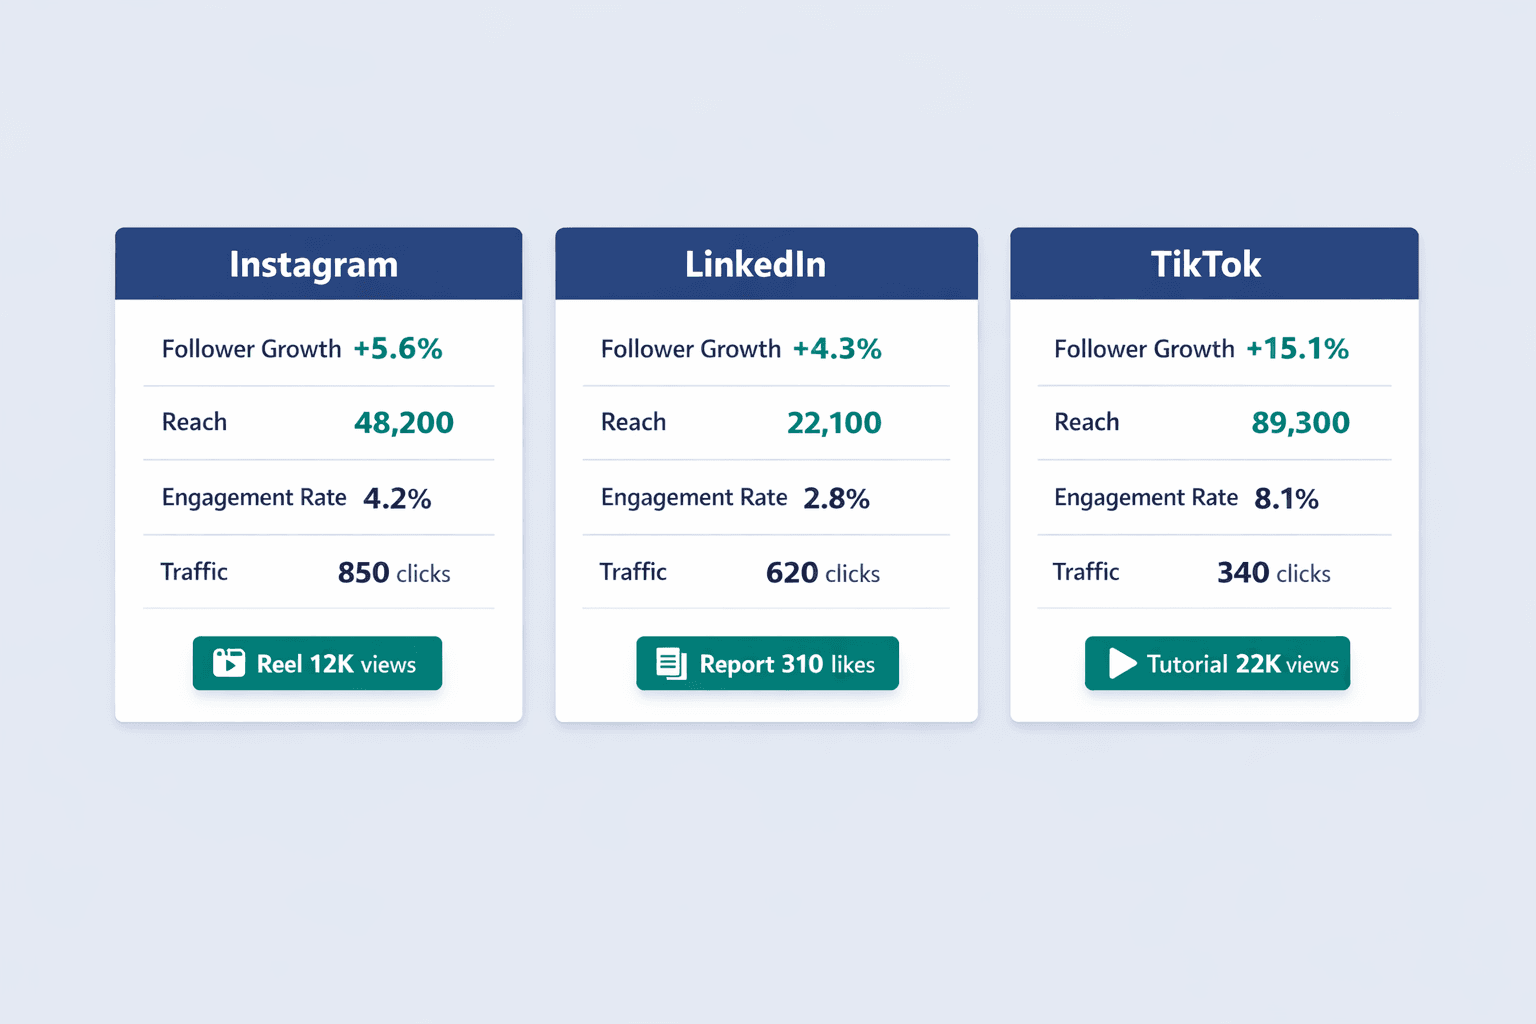
Show per-platform results side-by-side to identify where your audience is most engaged.
| Platform | Followers (Start) | Followers (End) | Growth % | Posts | Reach | Engagement Rate | Top Post | Traffic Driven |
|---|---|---|---|---|---|---|---|---|
| 12,400 | 13,100 | +5.6% | 18 | 48,200 | 4.2% | Product launch Reel (12K views) | 850 clicks | |
| 8,200 | 8,550 | +4.3% | 12 | 22,100 | 2.8% | Industry report (310 likes) | 620 clicks | |
| TikTok | 5,300 | 6,100 | +15.1% | 15 | 89,300 | 8.1% | Tutorial video (22K views) | 340 clicks |
Content Performance Analysis
Identify which content formats drive the best results so you can create more of what works.
| Post Type | Number of Posts | Avg Engagement Rate | Avg Reach | Best Performing Example |
|---|---|---|---|---|
| Video | 12 | 6.8% | 18,500 | Product demo (25K views, 1,700 engagements) |
| Image | 15 | 3.2% | 12,300 | Customer spotlight (8K reach, 394 engagements) |
| Carousel | 8 | 4.5% | 14,100 | Tips post (11K reach, 634 engagements) |
| Story | 24 | 5.1% | 9,200 | Behind-the-scenes (6K reach, 470 engagements) |
| Link post | 6 | 1.8% | 8,400 | Blog share (7K reach, 151 engagements) |
Audience Insights
Track demographic and behavioral data about who’s engaging with your content.
Audience metrics to track:
- Demographic breakdown - Age, gender, location of followers and engagers
- Peak engagement times - When your audience is most active
- Top locations - Geographic concentration of your audience
- Audience growth sources - Where new followers come from (organic, paid, hashtags)
- Follower quality indicators - Engagement rate by audience segment
Paid Social Performance
If running paid campaigns, track them separately with budget and ROAS data.
| Campaign Name | Platform | Budget | Impressions | Clicks | CTR | Conversions | CPC | ROAS |
|---|---|---|---|---|---|---|---|---|
| Lead Gen - March | Meta | $4,500 | 287,000 | 4,320 | 1.51% | 118 | $1.04 | 3.8x |
| Awareness - Product | TikTok | $3,200 | 512,000 | 2,840 | 0.55% | 47 | $1.13 | 2.1x |
| Retargeting | $2,100 | 98,400 | 890 | 0.90% | 34 | $2.36 | 4.2x |
Social Listening and Sentiment
Track what people are saying about your brand beyond just the content you publish.
Monitoring elements to include:
- Brand mentions volume - Total mentions across social platforms
- Sentiment breakdown - Percentage of mentions that are positive, neutral, negative
- Share of voice vs. competitors - Your mentions as a percentage of total category conversation
- Common themes/topics - What people are talking about when they mention you
- Crisis alerts - Spikes in negative sentiment that need immediate attention
Competitor Benchmarking
Compare your performance to key competitors where data is available.
| Competitor Name | Platform | Followers | Avg Engagement Rate | Posting Frequency | Content Strategy Notes |
|---|---|---|---|---|---|
| Competitor A | 45,200 | 3.8% | 4-5x/week | Heavy video focus, user-generated content | |
| Competitor B | 28,100 | 2.4% | Daily | Product-centric, minimal interaction | |
| Competitor C | 12,300 | 4.1% | 3x/week | Thought leadership, industry news |
Social Media Reporting Tools
Platforms that automate social media KPI reporting include:
- Native platform analytics - Built-in insights from Instagram, Facebook, LinkedIn, TikTok, X
- Sprout Social - Multi-platform reporting, competitor tracking, sentiment analysis
- Hootsuite Analytics - Consolidated social performance and team collaboration
- Buffer Analyze - Post-performance tracking across platforms
- Socialbakers - AI-driven social media benchmarking and competitive intelligence
- Rival IQ - Competitor analysis and social listening
- Brandwatch - Advanced social listening and sentiment monitoring
- Later Analytics - Visual content planning with performance tracking
Best Practices for Marketing KPI Reporting
Proven strategies make reports more effective and actionable—stakeholders read them, decisions get made, performance improves.
Keep It Simple and Focused
Metric overload kills report usefulness. Too much data is a cited problem in ROI measurement—stakeholders get overwhelmed and miss what matters.
Simplification tactics:
- Limit to 10-15 key metrics - More than that and you’ve built a dashboard, not a decision tool
- Use visual hierarchy - Big numbers for critical KPIs, smaller text for supporting context
- Group related metrics - Revenue metrics together, awareness metrics together
- Highlight most important changes - Draw attention to significant shifts
- Provide context for numbers - Always show comparison points (previous period, target, benchmark)
Tell a Story with Data
Structure reports as narratives rather than data dumps. Start with the punchline, explain what changed and why, connect metrics to business impact, show cause and effect, and end with clear next steps.
For example: “Leads increased 22% because we reallocated $8K from paid search to paid social—LinkedIn campaigns delivered 3.8x ROAS vs. 2.1x for Google Ads. Next month: shift another $5K to double down on what’s working.”
Provide Context and Comparison
Raw numbers mean nothing without benchmarks. A 2.4% email click rate is good… or bad… depending on your industry and past performance.
Comparison types to include:
- Previous period performance - Month-over-month, quarter-over-quarter
- Same period last year - Year-over-year context for seasonality
- Targets/goals - Where you need to be vs. where you are
- Industry benchmarks - Platform averages or published industry data
- Competitor performance - Where publicly available or through competitive intelligence
Make It Visual
Use charts, graphs, and visual elements to communicate data quickly and clearly.
Visualization best practices:
- Use appropriate chart types - Line charts for trends, bar charts for comparisons, pie charts for composition
- Maintain consistent color coding - Green = positive, red = negative, same metrics = same color across reports
- Highlight key changes - Call out significant shifts with annotations or color
- Avoid 3D charts - They distort data and reduce clarity
- Label clearly - Every chart needs a title and axis labels
- Show trends over time - Line graphs for multi-period comparisons
- Respect data-to-ink ratio - Remove unnecessary decoration that doesn’t add meaning
Include Actionable Insights
Reports must translate data into decisions. Numbers without recommendations are just numbers.
Insight characteristics:
- Specific to the data shown - “Paid social ROAS increased 28% after creative refresh”
- Tied to business objectives - “This puts us 14% ahead of quarterly lead targets”
- Actionable by the audience - “Recommend reallocating $10K from search to social next month”
- Prioritized by impact - Lead with the biggest opportunities first
- Supported by data - Point to specific metrics that justify the recommendation
Establish Consistent Reporting Cadence
Regular, predictable reporting schedules build trust and enable performance tracking over time.
Cadence considerations:
- Match frequency to decision-making cycles - Monthly if budgets are reviewed monthly
- Balance detail with effort required - Don’t create weekly reports if no one reads them
- Set stakeholder expectations - Communicate when reports arrive and what’s included
- Allow time for data collection - Don’t schedule reports before data is complete (e.g., social platforms often delay 48 hours)
- Maintain consistency - Same structure, same timing, same definitions period over period
Automate Where Possible
Automation improves accuracy, timeliness, and frees up analyst time for insights instead of data entry.
Automation opportunities:
- Data collection from APIs - Pull metrics automatically instead of manual exports
- Scheduled report generation - Automated delivery via BI tools
- Alert triggers for anomalies - Threshold-based notifications when metrics spike or drop
- Standardized formatting - Templates that automatically populate with fresh data
- Distribution to stakeholders - Email subscriptions or Slack notifications when reports are ready
Common Marketing KPI Reporting Mistakes to Avoid
Frequent pitfalls undermine report effectiveness—here’s what not to do.
Tracking Vanity Metrics
Vanity metrics look impressive but don’t drive business decisions. They make you feel good without helping you make better choices.
Common vanity metrics to avoid:
- Total followers without engagement context - 50K followers means nothing if no one interacts
- Page views without conversion tracking - Traffic doesn’t matter if it doesn’t convert
- Email list size without open rates - 100K subscribers who don’t open emails have zero value
- Impressions without reach or frequency context - Were those 1M impressions shown to 1M people once or 100K people ten times?
- Clicks without conversion data - Clicks that don’t lead to outcomes are just wasted budget
- Video views without completion rate - Starting a video isn’t the same as watching it
Focus on metrics that tie to outcomes: conversions, revenue, customer acquisition cost, retention rate, lifetime value.
Lack of Clear Objectives
Reporting metrics without tying them to specific business goals creates noise, not signal. If you can’t explain why a metric matters, it doesn’t belong in the report.
Start every report with objective alignment. “This month’s report tracks progress toward Q2 goal: generate 1,500 qualified leads at <$100 CAC.” Every metric you include should connect to that goal.
Inconsistent Metric Definitions
Different stakeholders interpreting the same metric differently destroys trust in reporting. When sales thinks “lead” means something different than marketing does—problems multiply.
Solutions for consistent definitions:
- Document metric definitions - Write down exactly how each KPI is calculated
- Include calculation methods in reports - Add footnotes explaining formulas
- Standardize across teams - Get agreement on what “engagement,” “conversion,” or “qualified lead” means
- Educate stakeholders - Don’t assume everyone knows what metrics mean
- Maintain a metrics glossary - Central reference document everyone can access
For example, Google Analytics defines an engaged session as one lasting 10+ seconds, having a key event, or having 2+ page views. Document that definition so everyone measures engagement the same way.
Ignoring Data Quality Issues
Bad data leads to bad decisions. If your tracking is broken or your numbers are wrong, you’re worse off than having no report at all.
Data quality checks to run:
- Validate tracking implementation - Test that tags fire correctly and events are captured
- Audit for duplicate data - Check for double-counting from multiple tracking scripts
- Check for missing values - Identify gaps where data should exist but doesn’t
- Verify time zone consistency - Misaligned time zones create false reporting discrepancies
- Cross-reference with other sources - Compare numbers across platforms to catch errors
Mailchimp warns that bot activity and Apple Mail Privacy Protection can inflate email open rates—know these limitations and account for them in reporting.
Overwhelming with Too Much Data
Comprehensive reports that bury important insights under excessive detail don’t get read. If your stakeholders have to dig through 30 pages to find what matters—they won’t.
Create tiered reporting: executive summaries with 3-5 key metrics on page one, detailed channel breakdowns in the middle, technical appendices at the end. Let readers choose their depth.
FAQ
How often should I create marketing KPI reports?
Most teams create monthly marketing KPI reports as the standard cadence—frequent enough to spot trends but not so often that nothing meaningful changes. Weekly reports work for fast-moving campaigns or channels that need constant optimization. Quarterly reports are best for strategic reviews with leadership.
The right frequency depends on how quickly your metrics change and how often decisions get made. If your marketing budget gets reviewed monthly, monthly reports make sense. If you’re running daily paid campaigns, daily dashboards with monthly summary reports work better.
What's the difference between a KPI and a metric?
A KPI is a metric, but not all metrics are KPIs. Metrics are any measurable data point—page views, sessions, clicks, impressions. KPIs are the critical few metrics that directly measure progress toward specific business goals.
You have hundreds of metrics available. You should have 5-10 KPIs in any given report. KPIs are strategic; metrics are tactical. KPIs drive decisions; metrics provide context.
How many KPIs should be in a marketing report?
5-10 core KPIs for most reports. More than that and you dilute focus—too many metrics make everything seem equally important, which means nothing is actually important.
The exact number depends on complexity. A single-channel report might track 5 KPIs. A comprehensive marketing report covering organic, paid, social, email, and content might track 10-12. But if you’re reporting 20+ metrics, you’ve built a dashboard, not a decision tool.
What tools are best for creating marketing KPI reports?
Google Looker Studio (free) works for most small teams—it connects to Google Analytics, Google Ads, Search Console, and other data sources with scheduled PDF delivery. Google Sheets and Excel work for simple reports when you’re starting out.
Power BI and Tableau are better for larger organizations with complex data needs—they support advanced visualizations, enterprise data governance, and sophisticated automation. HubSpot, Salesforce, and other marketing platforms have built-in reporting if you’re already paying for them.
How do I know if I'm tracking the right KPIs?
Check if each KPI maps to a specific objective, influences decisions, is actionable by your team, and is understood by stakeholders. If a metric doesn’t meet all four criteria, it probably doesn’t belong in your report.
Ask: “If this number goes up or down, what decision would we make differently?” If the answer is “nothing,” it’s not a KPI—it’s just data.
Should marketing KPI reports include competitor data?
Competitive benchmarking adds valuable context where data is available, but it should supplement internal performance tracking, not replace it. Comparing your engagement rate to competitor engagement rates helps you understand if your performance is strong or weak relative to the market.
But don’t obsess over competitor data—most of it isn’t publicly available, and what you can see is often incomplete. Focus on your own performance trends and goals first. Add competitive context where it genuinely helps decision-making.