AI in Business Reporting: What Is Changing
AI is shifting business reporting from static monthly PDFs to real-time, predictive dashboards that update continuously. 52% of US companies already use AI in financial reporting.
Quick Verdict
AI is fundamentally changing business reporting by automating data collection, enabling real-time analysis, and generating intelligent insights that used to take hours or days. Instead of manually building static reports each month, organizations now deploy AI systems that continuously monitor metrics, detect patterns, and produce personalized dashboards on demand. 52% of US companies were already using AI in financial reporting by December 2024.
We’re seeing a major shift from traditional static reports—PDFs emailed on a schedule—to AI-powered dynamic reporting systems that update in real time and adapt to each user’s role. This matters because business moves faster than monthly review cycles. When an anomaly appears or a trend accelerates, waiting for the next quarterly report isn’t an option. AI-powered reporting catches these signals immediately and surfaces them where decisions actually happen.
This article explains how AI is reshaping reporting practices—from what’s automated to what’s predictive—and covers the modern design trends making these reports more interactive, accessible, and genuinely useful.
What Is AI in Business Reporting?
AI in business reporting means using machine learning and automation technologies to analyze data, detect patterns, and generate reports without constant manual intervention. Instead of an analyst pulling data from five systems, building charts, and writing summaries, AI handles those tasks automatically—often in seconds rather than hours.
Key AI technologies now used in reporting:
- Natural language generation — AI writes narrative explanations of data trends in plain English
- Predictive analytics — Forecasts future metrics based on historical patterns
- Automated data visualization — Creates charts and dashboards dynamically based on data changes
- Anomaly detection — Flags outliers and unusual patterns automatically
- Real-time data processing — Updates reports continuously instead of on a schedule
AI differs from traditional business intelligence tools because it doesn’t just display data you’ve already configured—it actively analyzes, interprets, and explains what’s happening. Traditional BI tools are powerful calculators. AI reporting systems are more like analysts that never sleep.
How AI Changes the Reporting Process
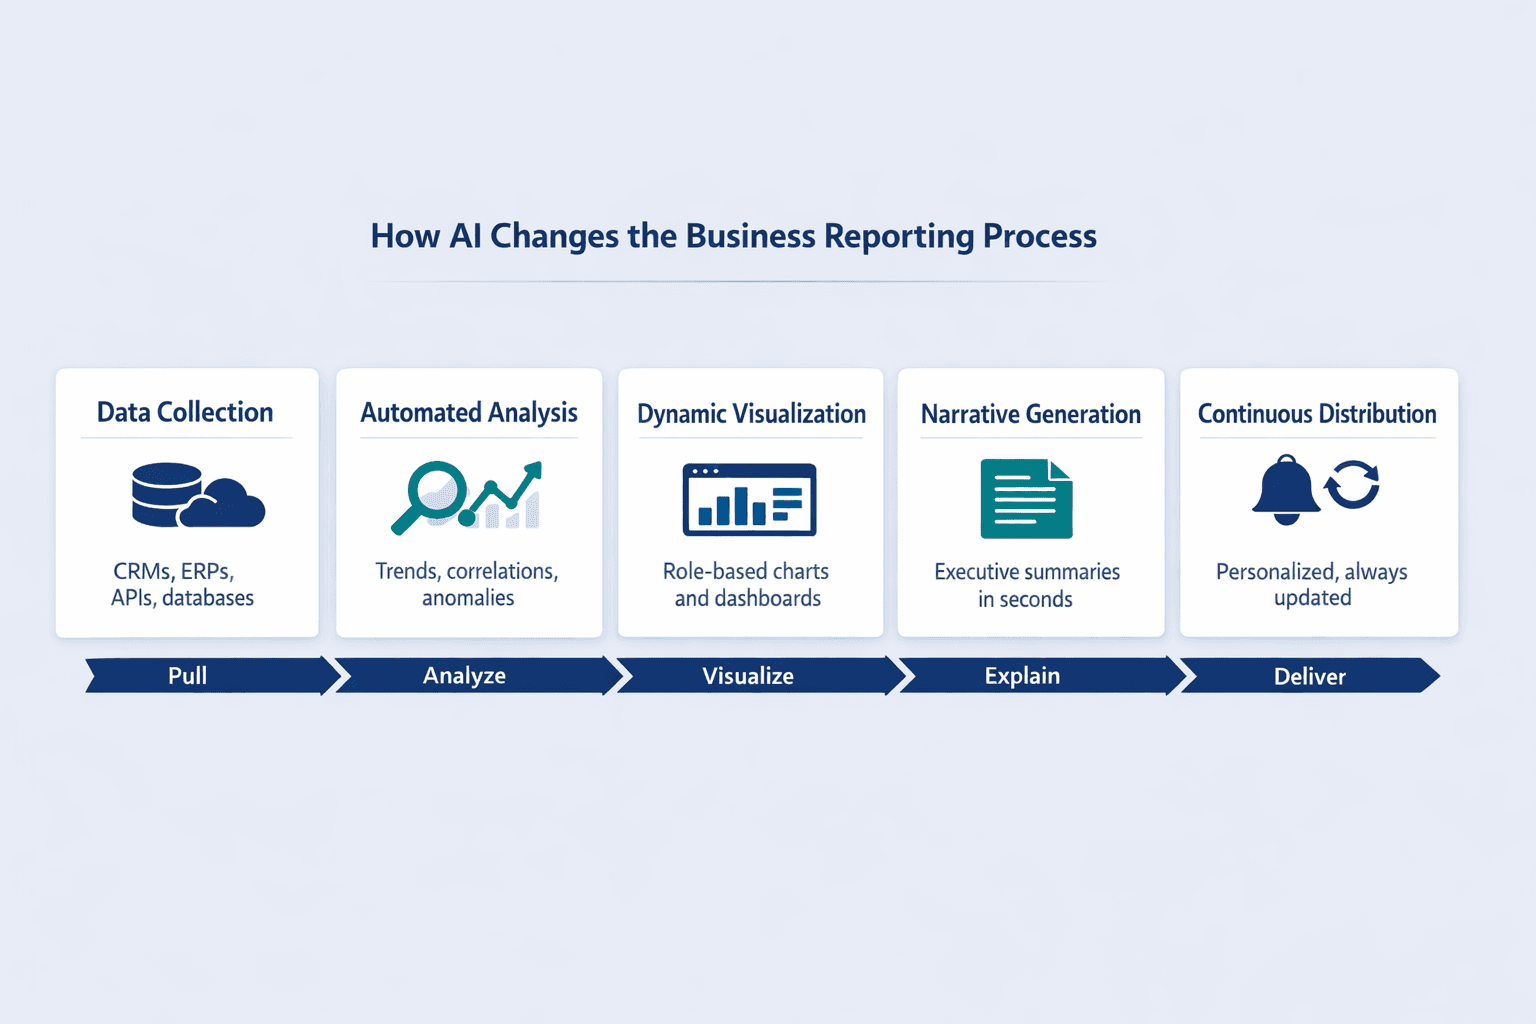
The traditional reporting workflow involved manual data gathering, spreadsheet analysis, chart building, narrative writing, and scheduled distribution. AI intervenes at every stage:
- Data collection: AI automatically pulls from CRMs, ERPs, APIs, and databases without manual exports or copy-paste
- Analysis: AI identifies trends, correlations, and anomalies without someone writing SQL queries or pivot tables
- Visualization: AI generates charts and dashboards dynamically based on what’s relevant to the viewer
- Narrative generation: AI writes executive summaries in seconds explaining what the data means
- Distribution and updating: AI delivers personalized insights continuously rather than sending the same PDF to everyone monthly
Types of AI-Powered Business Reports
AI is being applied across nearly every report category businesses rely on:
- Financial reports — P&L statements, cash flow analysis, budget variance reports
- Sales dashboards — Pipeline forecasts, deal velocity tracking, territory performance
- Performance analytics — KPI monitoring, goal tracking, productivity metrics
- Risk assessments — Credit risk scoring, fraud detection, compliance monitoring
- Market analysis — Competitive intelligence, customer sentiment tracking, demand forecasting
- Customer insights — Churn prediction, segmentation analysis, lifetime value modeling
- Operational reports — Supply chain monitoring, quality control metrics, resource utilization
How AI in Business Reporting Works
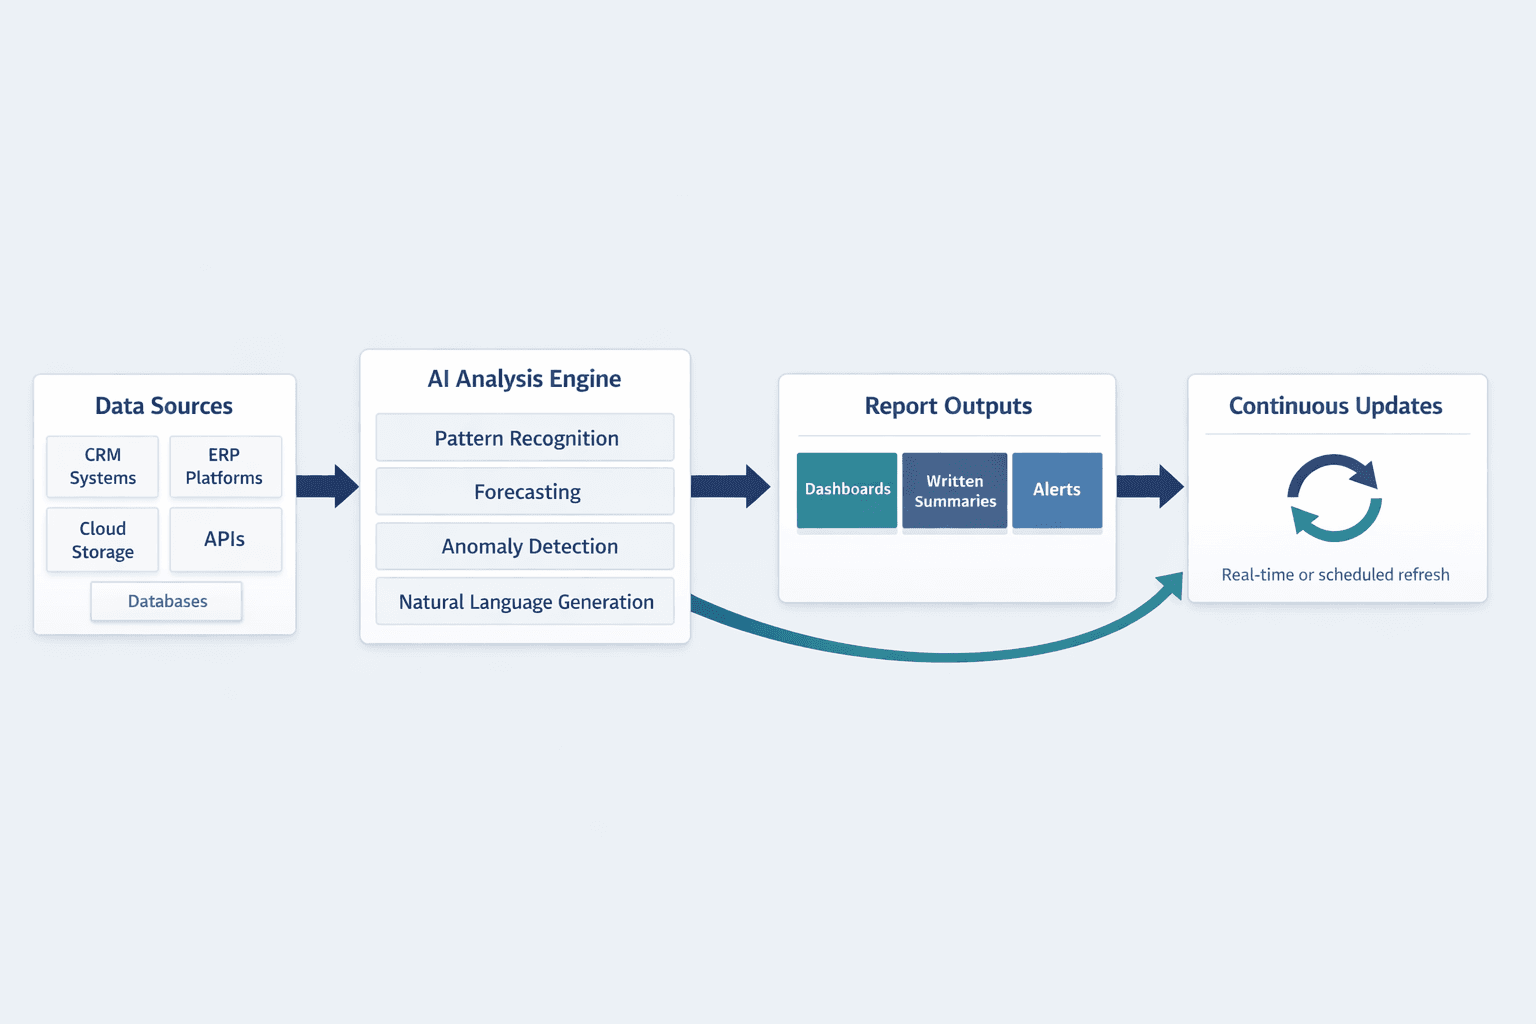
AI-powered reporting systems connect to your data sources, analyze patterns using machine learning models, and generate insights in formats ranging from dashboards to written summaries. The process is continuous rather than batch-based—when data changes, the report updates.
Data Collection and Integration
AI systems gather data from multiple sources automatically without manual exports. Once configured, they pull fresh data on a schedule or in real time.
Common data sources AI can integrate:
- CRM systems — Salesforce, HubSpot, Microsoft Dynamics
- ERP platforms — SAP, Oracle, NetSuite
- Cloud storage — Google Drive, Dropbox, SharePoint
- APIs — Custom integrations with internal tools and SaaS products
- Databases — SQL servers, data warehouses, cloud databases
Automated Analysis and Pattern Recognition
AI analyzes data to identify trends, patterns, and anomalies without manual intervention. Tableau Pulse automatically detects drivers, trends, contributors, and anomalies for the metrics business users care about.
Key analysis capabilities:
- Trend detection — Spots upward or downward movement in metrics over time
- Correlation identification — Finds relationships between variables that humans might miss
- Forecasting — Projects future outcomes based on historical patterns
- Outlier detection — Flags data points that don’t fit expected patterns
- Sentiment analysis — Interprets tone and emotion in text-based data like customer feedback
- Comparative analysis — Automatically compares performance across time periods, regions, or segments
Natural Language Generation for Reports
AI converts data findings into written narratives and explanations. Amazon Q in QuickSight can generate shareable documents and presentations in moments that explain data, extract key insights, and recommend best actions.
Benefits of NLG in reporting:
- Saves time — Eliminates hours of manual report writing
- Ensures consistency — Same phrasing and structure across reports
- Personalizes insights — Tailors language and focus to each user’s role
- Makes data accessible — Non-technical users understand findings without needing to interpret charts
Real-Time Reporting and Updates
AI enables continuous reporting rather than periodic snapshots. Instead of generating a report once a month, the system monitors data constantly and updates dashboards live.
Real-time reporting capabilities:
- Live dashboards — Charts and metrics refresh automatically as new data arrives
- Instant alerts — Notifications when important thresholds are crossed
- Dynamic updates — Reports reflect current state rather than last week’s export
- On-demand generation — Users can request fresh analysis any time
- Automated scheduling — Reports delivered at optimal times without manual sending
What Is Changing in Business Reporting Because of AI
AI is driving major transformations in how reports are created, delivered, and used. All surveyed US financial reporting leaders expected to be piloting or using AI in financial reporting within three years, and 97% said the same for generative AI.
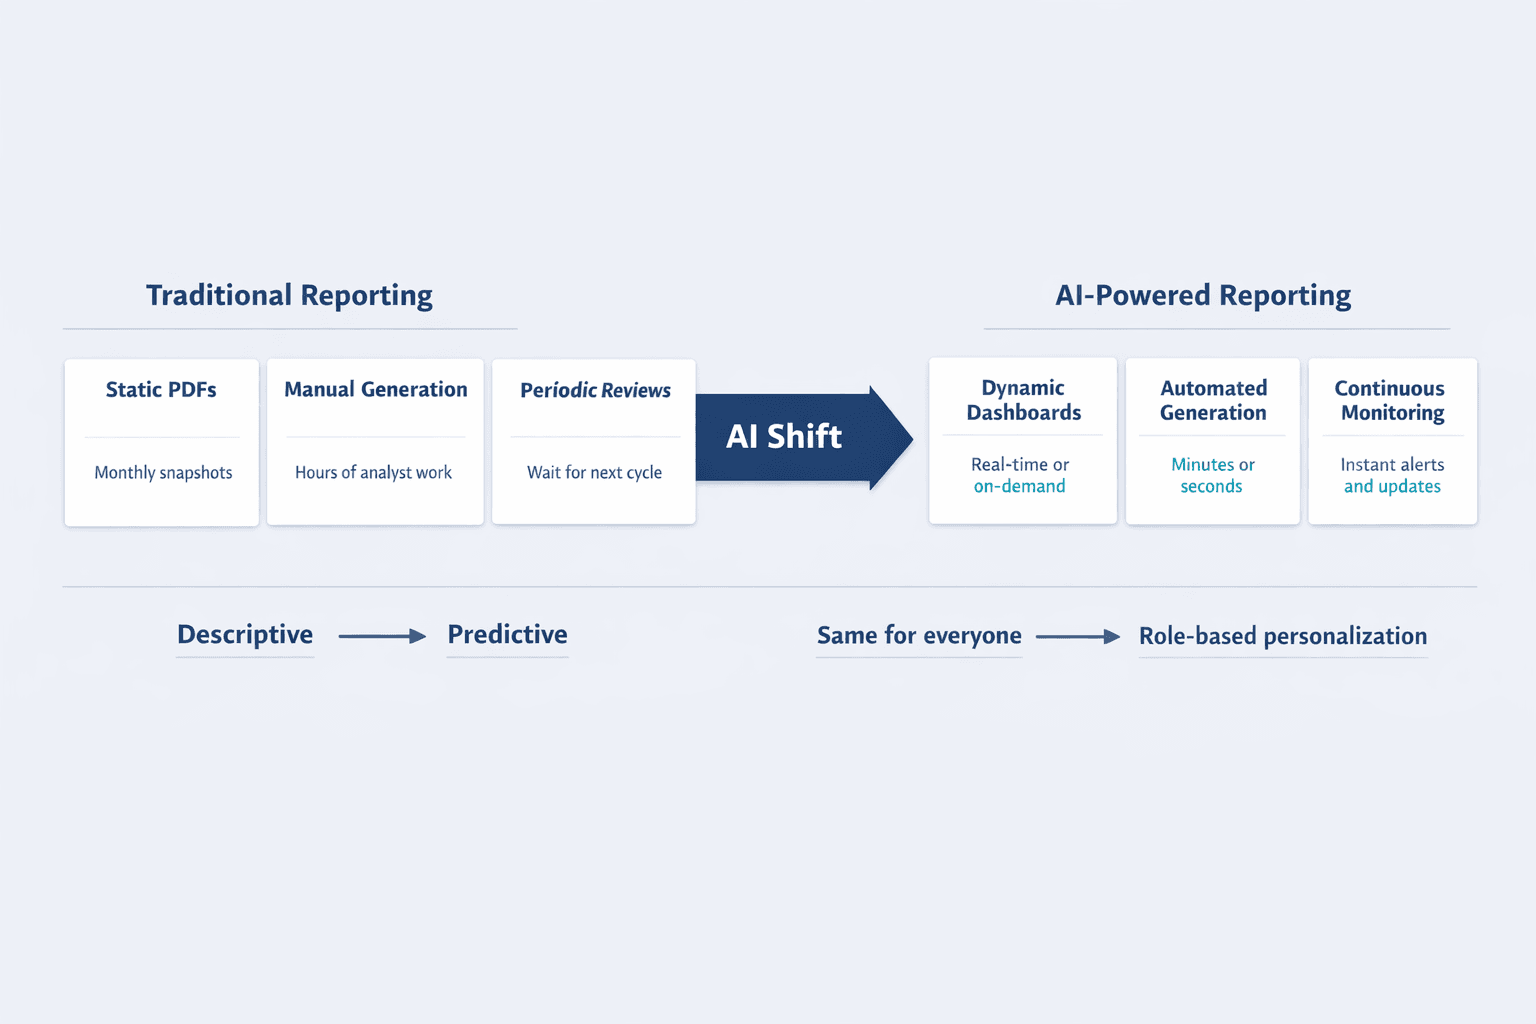
From Static to Dynamic Reports
The shift from fixed PDF reports to interactive, updating dashboards is one of the most visible changes. Static reports show a snapshot—usually outdated by the time they’re distributed. Dynamic reports reflect current reality.
| Feature | Static Reports | Dynamic Reports |
|---|---|---|
| Update frequency | Monthly/quarterly | Real-time or on-demand |
| Interactivity | Read-only | Drill-down, filters, queries |
| Personalization | Same for everyone | Role-based views |
| Data freshness | Days or weeks old | Current |
| Distribution | Email attachments | Shared links or embedded dashboards |
From Descriptive to Predictive Insights
AI moves reporting beyond “what happened” to “what will happen.” Traditional reports describe past performance. AI-powered reports forecast trends and flag emerging risks before they become problems.
Predictive capabilities now common in business reporting:
- Forecasting — Revenue projections, demand predictions, resource needs
- Scenario modeling — “What if” analysis showing impact of different decisions
- Risk prediction — Early warnings about customer churn, supply disruptions, or compliance issues
- Opportunity identification — Spots patterns that suggest new revenue or efficiency gains
- Trend projection — Extends historical patterns to predict future states
From Manual to Automated Report Generation
AI reduces manual reporting work from hours to minutes. Users can create shareable documents in moments from a short prompt, complete with explanations, visuals, key insights, and recommended actions.
Tasks now automated:
- Data gathering — No more manual exports or copy-paste between systems
- Chart creation — Visualizations generated automatically based on data type
- Narrative writing — AI writes summaries and explanations in plain language
- Formatting — Consistent layouts and branding without manual design work
- Distribution — Reports sent automatically to the right people at the right time
- Version control — No confusion about which report is current
From Periodic to Continuous Monitoring
Monthly or quarterly reporting cycles are giving way to always-on analytics. AI-powered systems monitor metrics continuously and alert users when something important happens—no need to wait for the next scheduled report.
Increased Personalization and Relevance
AI tailors reports to individual user roles and needs. A CFO sees financial summaries. A sales manager sees pipeline metrics. Both get insights relevant to their decisions—from the same underlying data.
Personalization features:
- Role-based views — Different dashboards for different functions
- Custom metrics — Each user sees the KPIs they actually care about
- Relevant alerts — Notifications filtered by responsibility and authority
- Adaptive dashboards — Layout and focus adjust based on usage patterns
Modern Business Report Design Trends
Report design is evolving alongside AI capabilities. The goal is making complex data more accessible, actionable, and engaging.
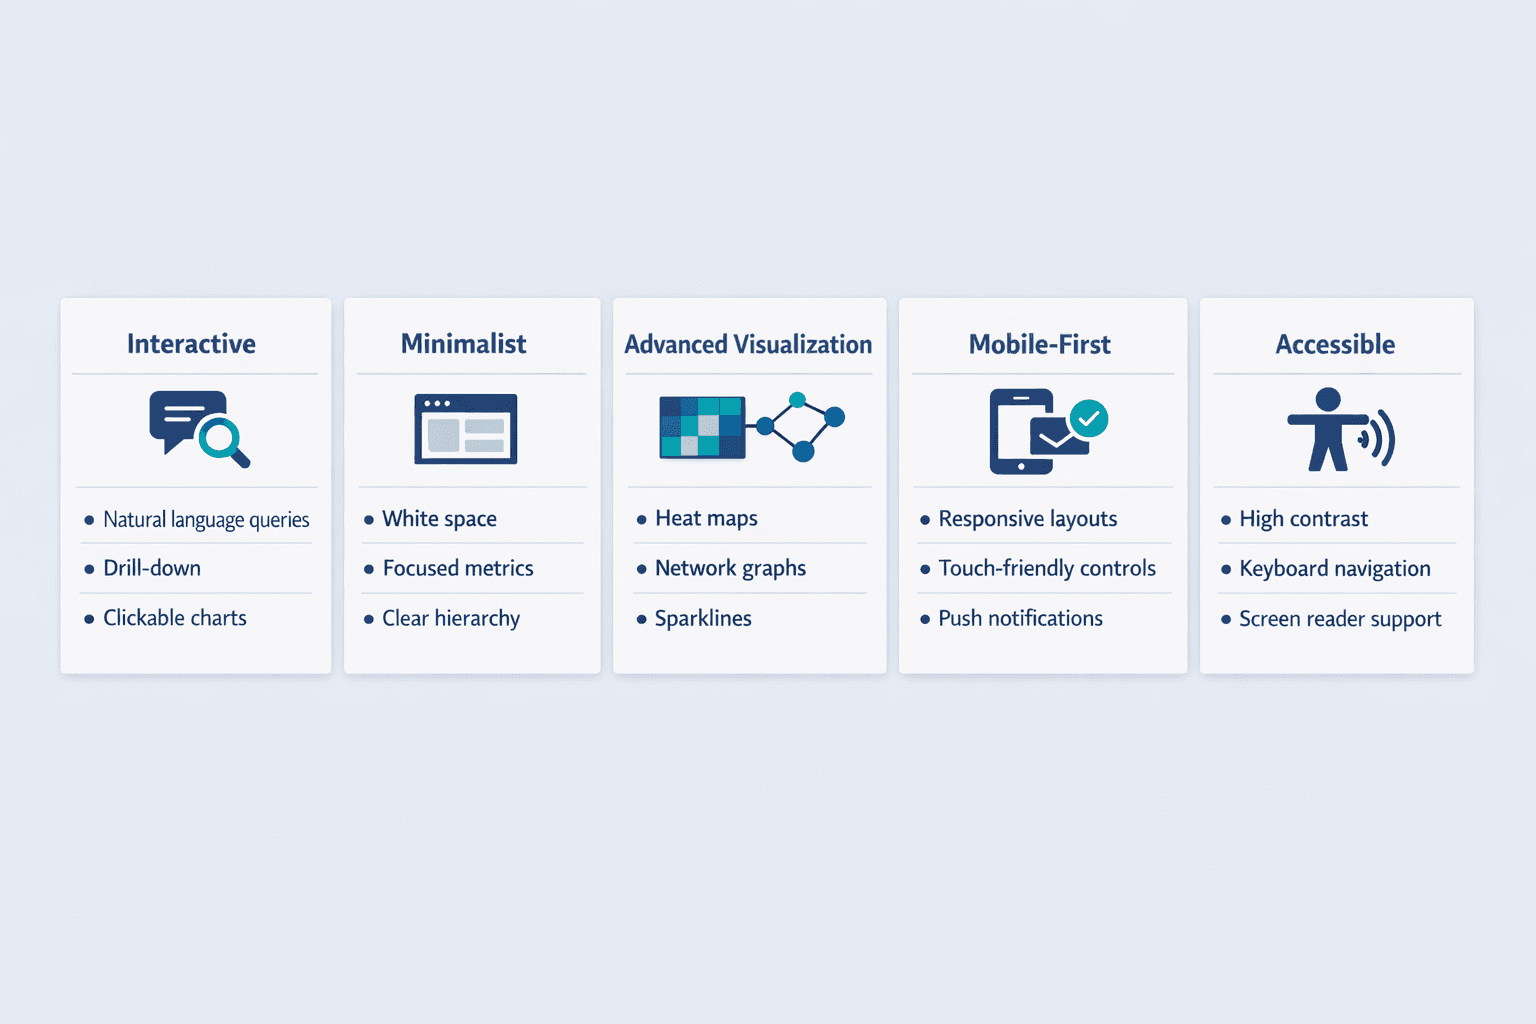
Interactive and Conversational Interfaces
Reports increasingly respond to user queries and allow exploration. Copilot in Power BI lets users ask questions about report data in natural language and get answers instantly.
Interactive design elements:
- Chatbot interfaces — Ask questions in plain language instead of clicking through menus
- Drill-down capabilities — Click a summary metric to see underlying details
- Filters and slicers — Users control what data they see without rebuilding reports
- Natural language queries — Type “show me sales by region last quarter” instead of configuring filters
- Clickable visualizations — Charts that link to related data or deeper analysis
Minimalist and Data-Focused Layouts
Modern reports favor cleaner, less cluttered designs. The trend is toward simplicity that directs attention to what matters rather than decorative elements that distract.
Minimalist design principles:
- White space usage — Breathing room between elements improves readability
- Focused metrics — Show the 5 numbers that matter, not 50
- Clear hierarchy — Size, color, and position guide the eye to key insights first
- Simplified color schemes — Limited palettes reduce visual noise
- Reduced decoration — Fewer gradients, shadows, and ornamental graphics
- Mobile-first layouts — Designs that work on small screens by default
Advanced Data Visualization Techniques
Modern visualization approaches make complex data more accessible. AI systems can generate sophisticated charts automatically based on what the data actually shows.
Trending visualization types:
- Interactive charts — Hover, click, and explore rather than static images
- Animated data stories — Sequences that show how metrics evolve over time
- Heat maps — Color-coded grids showing patterns across multiple dimensions
- Network graphs — Visualize relationships and connections in systems or organizations
- Geospatial maps — Location-based data displayed on maps rather than tables
- Sparklines — Tiny inline charts showing trends next to numbers
- Infographic elements — Visual metaphors and icons that make abstract metrics concrete
Mobile-First and Responsive Design
Modern reports prioritize mobile accessibility. Mobile accounted for the majority of worldwide web usage in 2024, which means business users increasingly access reports from phones and tablets.
Mobile design considerations:
- Responsive layouts — Reports reflow and resize for different screen sizes
- Touch-friendly controls — Buttons and interactive elements sized for fingers, not mouse pointers
- Simplified views — Mobile versions focus on key metrics rather than showing everything
- Offline access — Reports load and function even when connectivity is spotty
- Push notifications — Alerts delivered directly to mobile devices
Storytelling and Narrative Structures
Modern reports use narrative techniques to communicate insights. Rather than dumping data and leaving interpretation to the reader, AI-powered reports guide users through findings with a clear story arc.
Storytelling elements:
- Executive summaries — Key takeaways upfront before diving into details
- Key insights callouts — Important findings highlighted visually
- Sequential flow — Information organized in logical reading order
- Context annotations — Explanatory notes attached to charts and metrics
- Visual hierarchy — Design that guides readers from big picture to supporting evidence
Dark Mode and Accessibility Features
Inclusive design trends are becoming standard in business reporting. WCAG 2.2 added new success criteria in 2023 aimed at helping users find content, operate functionality more easily, and avoid mistakes.
Accessibility features:
- Dark mode options — Reduces eye strain for users working in low-light environments
- High contrast modes — Improves readability for users with visual impairments
- Screen reader compatibility — Proper semantic structure and alt text for assistive technology
- Keyboard navigation — Full functionality without requiring a mouse
- Adjustable text sizes — Users can increase font sizes without breaking layouts
- Color-blind friendly palettes — Charts and visualizations don’t rely solely on color to convey meaning
Real-Time Collaborative Features
Design elements that enable team collaboration on reports are increasingly common. Modern reporting is less about distributing static files and more about shared workspace.
Collaborative design features:
- Commenting systems — Team members can discuss findings directly within reports
- Shared annotations — Highlight and mark up data for colleagues
- Version tracking — See who changed what and when
- Simultaneous viewing — Multiple users can explore the same live dashboard together
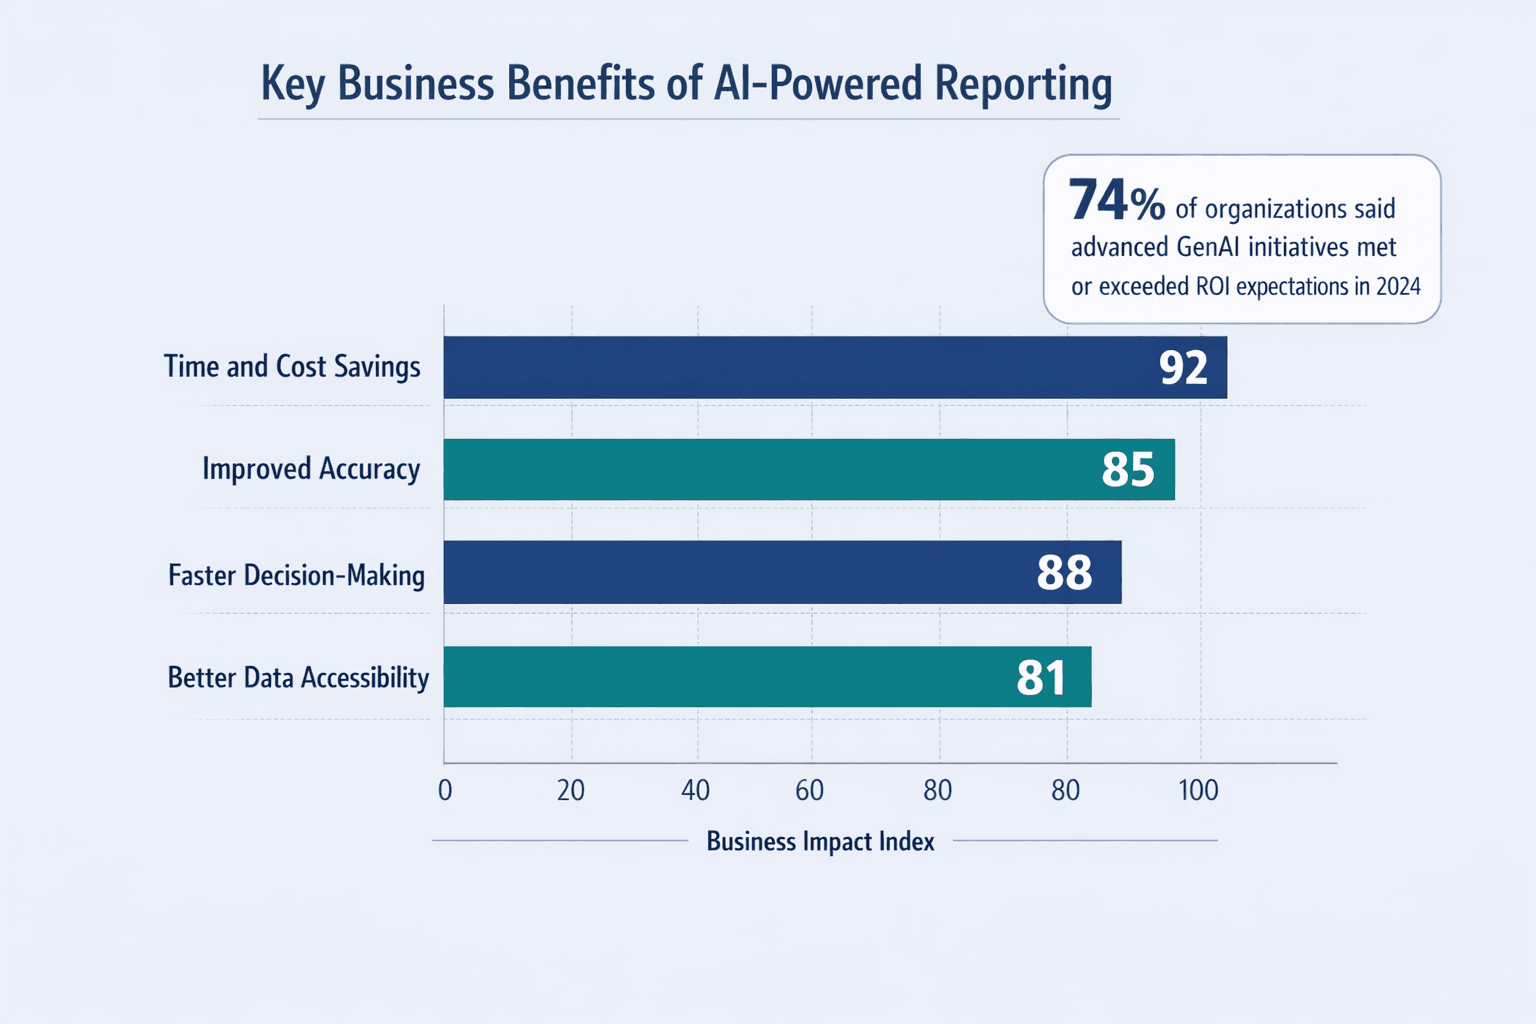
Benefits of AI-Powered Business Reporting
Organizations are adopting AI reporting tools because they deliver measurable improvements. 74% of organizations said their most advanced GenAI initiative was meeting or exceeding ROI expectations in 2024.
Time and Cost Savings
Efficiency gains from automated reporting are substantial. Tasks that took hours now happen in minutes—sometimes seconds.
Specific savings:
- Reduced manual data entry — No more copying numbers between systems
- Faster report generation — Minutes instead of hours or days
- Lower error correction costs — Automation eliminates many manual mistakes
- Decreased analyst workload — Teams spend less time building reports, more time acting on insights
- Automated distribution — No manual emailing or file sharing
Improved Accuracy and Consistency
AI reduces human error in reporting. Standardized calculations and automated validation catch mistakes that slip through manual processes.
Accuracy improvements:
- Standardized calculations — Same formulas applied consistently across reports
- Automated error detection — Systems flag impossible values or inconsistencies
- Consistent formatting — Reports look the same every time without manual design work
- Validated data sources — Connections to verified systems rather than ad hoc spreadsheets
Faster Decision-Making
Real-time insights accelerate business responses. When Tableau Pulse automatically detects metric drivers, trends, and anomalies, business users can act immediately rather than waiting for the next scheduled review.
Better Data Accessibility for Non-Technical Users
AI democratizes data access across organizations. Business users can ask questions in natural language rather than learning tools or code.
Accessibility features:
- Natural language interfaces — Ask questions in plain English instead of writing queries
- Automated explanations — AI interprets findings so non-analysts understand what data means
- Simplified visualizations — Charts designed for clarity rather than technical precision
- Self-service tools — Users get answers without waiting for analysts
- Guided analysis — Systems suggest next questions or relevant views
Challenges and Considerations
Implementing AI reporting isn’t without obstacles. Poor data quality costs organizations at least $12.9 million per year on average, and data remains a critical challenge to scaling generative AI.
Data Quality and Integration Issues
AI reporting accuracy depends heavily on clean, connected data. Garbage in, garbage out still applies—AI just processes garbage faster.
Common data challenges:
- Inconsistent formats — Same data stored differently across systems
- Incomplete records — Missing values or gaps in historical data
- Siloed systems — Data trapped in disconnected tools that don’t talk to each other
- Legacy data sources — Old systems that are hard to integrate
- Real-time sync issues — Delays between when data changes and when reports reflect it
Learning Curve and Change Management
Organizational challenges in adopting AI reporting tools can be bigger than technical ones. Scaling value is as much an organizational change challenge as a technical one.
Change management considerations:
- Training requirements — Teams need time to learn new interfaces and workflows
- User resistance — People comfortable with existing processes may push back
- Process adjustments — Existing workflows often need redesign
- Workflow integration — New tools must fit into how work actually gets done
Privacy and Security Concerns
Data protection issues with AI-powered reporting matter more as systems aggregate information from multiple sources. The global average cost of a data breach reached $4.88 million in 2024.
Security considerations:
- Data encryption — Protecting information in transit and at rest
- Access controls — Ensuring users only see data they’re authorized for
- Compliance requirements — Meeting GDPR, HIPAA, SOX, or other regulatory standards
- Audit trails — Tracking who accessed what data and when
- Third-party risks — Vendor security practices and data handling policies
Over-Reliance on Automation
Maintaining human oversight in AI reporting is critical. AI can help teams work better and faster, but it can never replace human judgment.
Even with advanced AI, organizations need people to:
- Validate that automated findings make business sense
- Question anomalies and unusual patterns
- Understand context that data alone can’t capture
- Make final decisions based on insights, not delegate them to algorithms
The Future of Business Reporting with AI
Emerging trends and what’s coming next:
- Augmented analytics — AI systems that not only report findings but actively recommend decisions
- Voice-activated reports — Ask questions out loud and get spoken answers
- AI-powered recommendations — Systems that suggest specific actions based on data patterns
- Autonomous decision systems — AI that executes routine decisions without human approval
- Hyper-personalization — Reports that adapt in real time to each user’s goals and behavior
- Industry-specific AI models — Pre-trained systems that understand finance, healthcare, retail, or manufacturing nuances
Agentic AI is on the rise as organizations continue scaling GenAI at their own pace. The future is less about static reports and more about continuous intelligence—systems that monitor, analyze, alert, and sometimes act without waiting for human direction.
FAQs
What industries benefit most from AI in business reporting?
Finance-heavy industries are leading adoption. 52% of companies were using AI in financial reporting by December 2024. Healthcare, retail, manufacturing, and professional services also see strong benefits—anywhere complex data needs to be analyzed quickly and accurately.
Do I need technical skills to use AI reporting tools?
Not anymore. Modern AI reporting platforms increasingly use natural language interfaces that let business users ask questions in plain English. You don’t need to write code or learn complex query languages. That said, understanding your data—what it represents and where it comes from—still matters.
How much do AI business reporting tools cost?
Pricing varies widely. Standalone AI reporting tools typically range from $10-50 per user per month for small business plans to enterprise pricing in the hundreds or thousands depending on scale. Many platforms offer free trials. Some AI features are being bundled into existing business intelligence tools at no extra cost.
Can AI reporting tools integrate with existing business systems?
Yes. Most modern AI reporting platforms can connect to CRMs like Salesforce, ERPs like SAP or NetSuite, cloud storage, databases, and custom APIs. Integration complexity depends on your systems—cloud-native tools typically connect easily, while legacy on-premise systems may need more work.
How accurate are AI-generated business reports?
Accuracy depends heavily on source data quality. AI systems apply calculations consistently and flag anomalies reliably—but if the underlying data is incomplete or wrong, the report will be too. Best practice is treating AI as a powerful assistant that still needs human validation, especially for high-stakes decisions.