Best KPI Report Software Compared
Compare Power BI, Tableau, Looker Studio Pro, and five other KPI tools by integration depth, customization, and pricing to match your data sources and team skills.
Quick Verdict
Power BI, Tableau, and Looker Studio Pro lead the KPI reporting software market—Power BI for enterprise integration depth, Tableau for advanced analytics authoring, and Looker Studio Pro for Google-centric teams. For specialized use cases, Geckoboard excels at live KPI dashboards while AgencyAnalytics dominates marketing and SEO reporting.
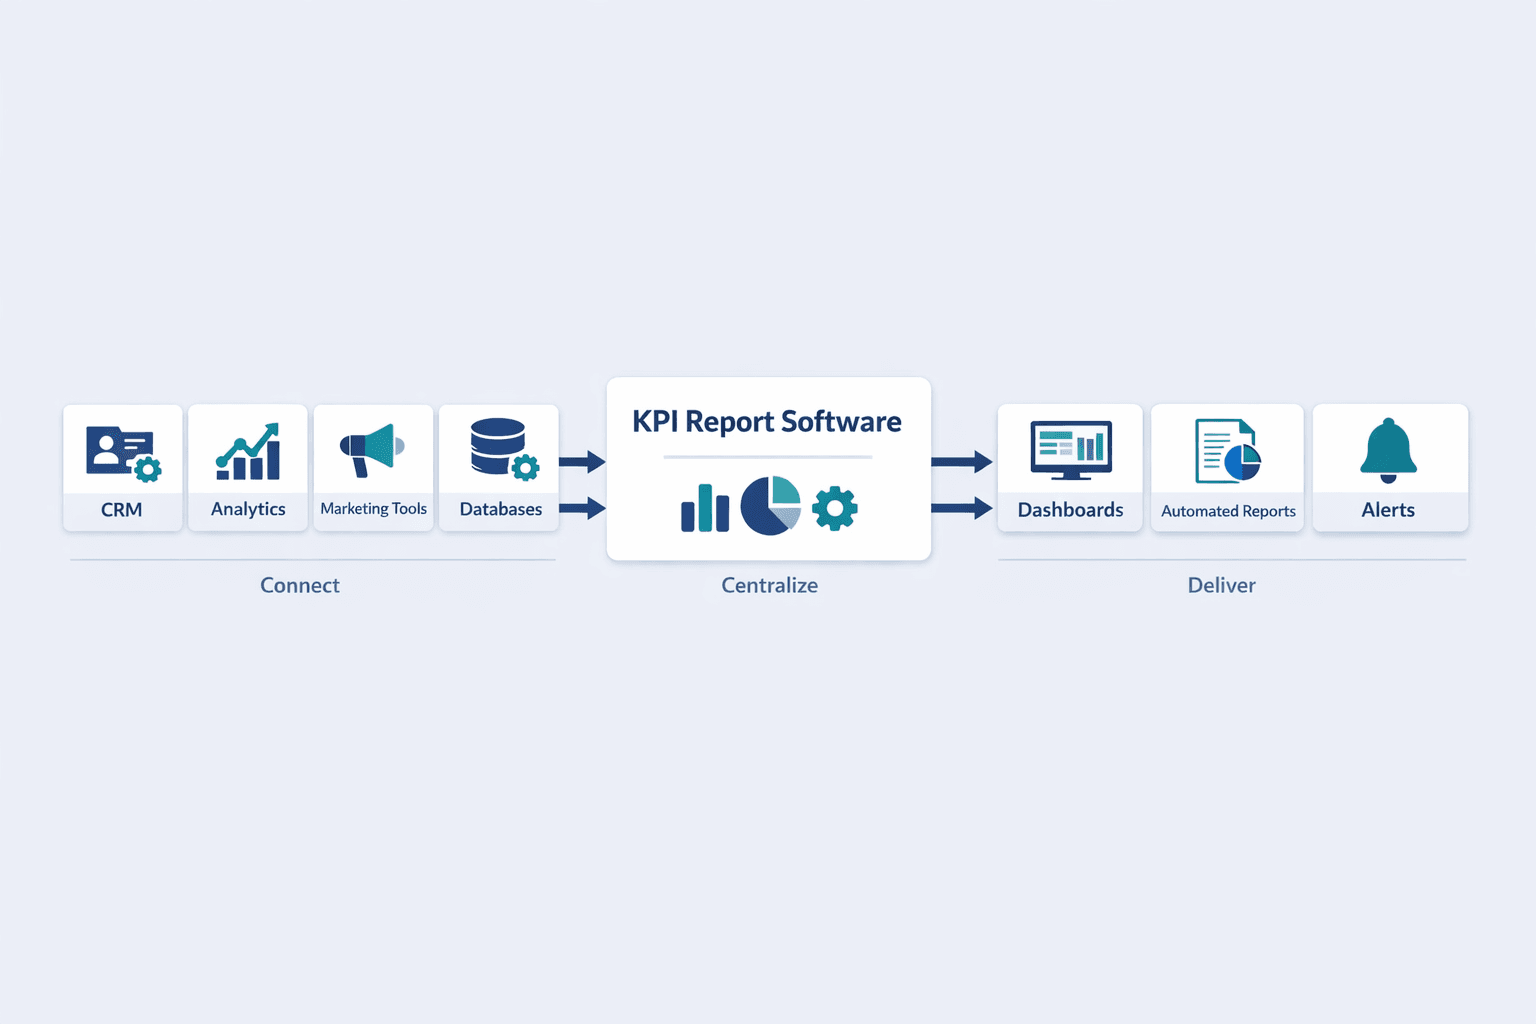
Businesses need KPI reporting software because executives and managers can’t make good decisions with data scattered across spreadsheets, marketing tools, and databases. According to Salesforce’s State of Data and Analytics report, organizations still struggle to activate their data effectively—KPI software solves this by centralizing metrics and automating updates.
This comparison covers five general KPI platforms, three SEO-specific solutions, and a decision framework that matches your data sources, customization needs, and team skills to the right tool.
What is KPI Report Software?
KPI report software pulls data from multiple sources—CRM, analytics, marketing tools—and displays key metrics in dashboards that update automatically. It turns scattered performance data into centralized visibility so teams can track progress and spot problems without manual reporting.
Key features that define KPI reporting tools:
- Real-time dashboards — Visual metrics that refresh hourly or daily
- Automated report delivery — Scheduled email or Slack snapshots
- Cross-source data integration — Connect databases, spreadsheets, and cloud apps
- Custom visualizations — Charts, tables, and KPI cards tailored to your metrics
- Sharing and collaboration — Team workspaces, public links, and mobile access
Executives use KPI software to monitor company health at a glance. Department managers track progress toward goals. Analysts build reports once and let them run automatically. Anyone who needs to answer “how are we doing?” repeatedly without rebuilding spreadsheets every week benefits from KPI reporting tools.
Top KPI Report Solution Providers
The solutions below were chosen based on integration breadth, visualization depth, automation capabilities, and pricing transparency. Each serves a different balance of technical complexity, customization, and cost.
Power BI
Power BI is Microsoft’s enterprise BI platform built for analysts who need deep data modeling and governance alongside dashboard creation. It’s the strongest option when you have complex data sources, want to blend on-premises and cloud systems, or already live in the Microsoft ecosystem.
| Feature | Details | Best For | Limitations |
|---|---|---|---|
| Pricing | $14/user/month (Pro, paid yearly); Desktop is free | Enterprise teams, analysts | Premium features require separate capacity licensing |
| Integrations | Databases, Azure, files, online services, Power Platform, Fabric | Multi-source reporting | Some connectors are Beta or not available in cloud service |
| Visualization | Drag-and-drop report builder, custom visuals marketplace | Building interactive reports | Steeper learning curve than simpler dashboard tools |
| Automation | Scheduled refresh, gateways for on-premises data, alerts | Governed enterprise reporting | Requires admin setup for gateways and semantic models |
Standout capabilities:
- Free Desktop authoring tool — Build reports locally before deploying to the cloud
- DirectQuery and live connections — Real-time dashboards without importing data
- Row-level security and governance — Enterprise-grade data access control
- Natural language Q&A — Type questions and get chart answers
Tableau
Tableau is the most powerful option for advanced analytics and interactive exploration—think data analysts, data scientists, and teams that need to go beyond static KPI dashboards into ad-hoc analysis and what-if scenarios.
| Feature | Details | Best For | Limitations |
|---|---|---|---|
| Pricing | $15 Viewer, $42 Explorer, $75 Creator per user/month (billed annually) | Advanced analytics teams | High cost for Creator licenses |
| Integrations | Databases, cloud apps, files, web data connectors | Multi-platform data blending | Connector quality varies by source |
| Visualization | Best-in-class chart library, drag-and-drop design | Interactive exploration | Overkill for simple KPI monitoring |
| Collaboration | Viewer/Explorer/Creator roles, governed workspaces | Teams with mixed technical levels | Requires planning around license types |
Standout capabilities:
- Three-tier licensing — Pay only for the access level each user needs (view, explore, or create)
- Visual analytics workflow — Build dashboards by dragging fields onto canvases, no code required
- Ask Data feature — Natural language queries against your data
- Mobile-optimized layouts — Design once, works across devices
Looker Studio Pro
Looker Studio Pro is Google’s managed reporting platform—it’s the natural choice if your team uses Google Workspace, BigQuery, or Google Analytics and you want scheduled delivery, team workspaces, and alerts without heavy infrastructure.
| Feature | Details | Best For | Limitations |
|---|---|---|---|
| Pricing | Per-user licensing, requires Google Workspace or Cloud Identity | Google-centric teams | Pricing not publicly listed; requires Google Cloud billing |
| Integrations | BigQuery, Google Analytics, Ads, Sheets, SQL databases, third-party connectors | Cloud-first data stacks | Fewer non-Google connectors than Power BI or Tableau |
| Automation | Up to 200 delivery schedules per report, Google Chat delivery, alerts | Recurring stakeholder reporting | Some advanced features require Looker (not Studio Pro) |
| Collaboration | Organizational ownership, team workspaces, personal report links | Marketing and analytics teams | Must be a Google Workspace or Cloud Identity user |
Standout capabilities:
- Scheduled delivery to Google Chat — Push reports directly into team channels
- Personal report links — Let viewers customize filters without editing the source report
- Mobile access — View and share reports from iOS or Android apps
- 200 delivery schedules per report — Automate reporting at scale
Geckoboard
Geckoboard is a KPI-first dashboard tool built for operations, customer success, and leadership teams who want live metrics on screens, mobile, and Slack—without learning a full BI platform.
| Feature | Details | Best For | Limitations |
|---|---|---|---|
| Pricing | $119/month Essentials, $399/month Performance (billed annually) | Live KPI monitoring | Priced by dashboards, editors, and screens—not pure user seats |
| Integrations | Real-time updates, all integrations included | Cloud apps and APIs | Not designed for deep data modeling |
| Visualization | Pre-built widgets, dashboard loops, TV screen mode | Non-technical teams | Limited custom chart types |
| Sharing | Sharing links, snapshots for Slack/Teams/email, mobile access | Stakeholder visibility | No embedded analytics or white-label options on Essentials |
Standout capabilities:
- Real-time data updates — Metrics refresh continuously, not on a schedule
- Dashboard loops and TV screens — Cycle through multiple dashboards on office monitors
- Alerts on key metrics — Get notified when KPIs cross thresholds (Performance tier)
- Unlimited viewers — Share dashboards without per-user charges
Databox
Databox is built for marketing teams, agencies, and SMBs who want centralized KPI dashboards without heavy technical setup—think HubSpot, Google Analytics, and ad platform data in one view.
| Feature | Details | Best For | Limitations |
|---|---|---|---|
| Pricing | Free plan available; paid plans by base tier + add-ons | Marketing and sales teams | Total cost increases with data sources and add-ons |
| Integrations | 120+ integrations, hourly updates on Professional tier | Multi-tool marketing stacks | Extra data sources cost more beyond plan limits |
| Automation | Goals, alerts, scheduled reports, AI summaries (Growth tier) | Recurring performance reviews | AI features locked behind higher tiers |
| Historical data | Up to 24 months (Professional), unlimited where supported (Growth/Premium) | Trend analysis | Free plan is limited to 3 data sources |
Standout capabilities:
- 10% quarterly, 20% yearly billing discounts — Lower cost with longer commitments
- AI summaries and forecasts — Automated insights on Growth tier
- Benchmarks — Compare your performance against industry averages
- Unlimited dashboards and reports — Scale reporting without seat charges
SEO Business Report Software: Specialized Solutions
SEO businesses track metrics that general KPI software doesn’t natively support—keyword rankings, backlink profiles, technical site health, and competitive positioning. Most BI platforms can pull Google Analytics and Search Console data, but they won’t track rank changes, crawl budget, or domain authority without heavy custom work.
SEO-specific tools integrate rank trackers, backlink databases, site audits, and competitive intelligence into one reporting stack. If your business sells SEO services or manages multiple client websites, these platforms save time by automating the data collection that would otherwise require spreadsheet exports and manual updates.
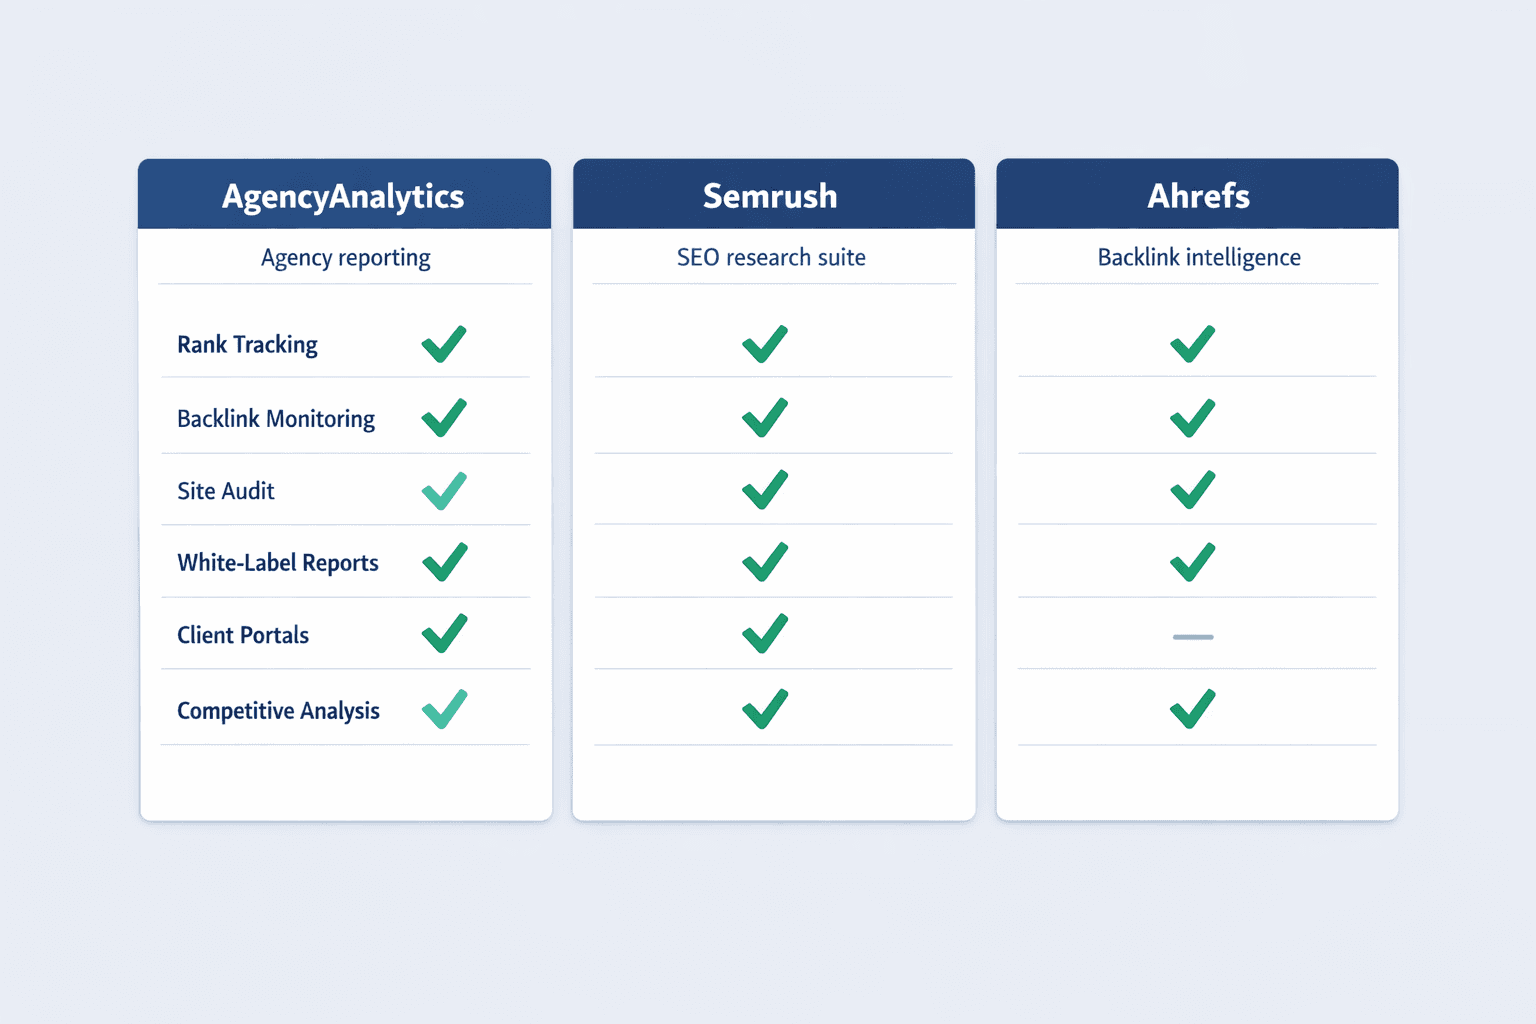
AgencyAnalytics
AgencyAnalytics is purpose-built for marketing agencies—it combines SEO, PPC, social, and analytics data into white-label client reports. If you bill clients monthly and need branded dashboards that update automatically, this is the cleanest option.
SEO-specific features:
- Rank tracking — Monitor keyword positions across search engines and locations
- Backlink monitoring — Track new and lost backlinks with domain authority metrics
- Traffic analysis — Blend Google Analytics and Search Console data in one view
- Competitor data — Compare client performance against competitor domains
- Client reporting — Automated reports, white-label branding, client portals
- Anomaly detection and alerts — Get notified when rankings drop or traffic spikes
Semrush
Semrush is a full SEO platform with reporting as one component—it’s the best choice when you need deep competitive research, keyword discovery, and technical audits alongside KPI dashboards. The reporting tools are strong, but the real value is the underlying SEO database.
SEO-specific features:
- Position tracking — Track keyword rankings with historical data and competitor comparison
- Backlink analytics — Full backlink database with referring domains, anchor text, and authority scores
- Site audit — Technical SEO crawls that identify issues and track health scores
- Traffic analytics — Estimate competitor traffic and reverse-engineer their best pages
- Custom reports — Build client-facing reports with your logo and selected metrics
- Seven-day free trial — Test workflows before committing
Ahrefs
Ahrefs is the strongest option for backlink-focused reporting and competitive analysis—if your SEO strategy revolves around link building and understanding competitor content, Ahrefs’ reporting tools integrate directly with the largest commercial backlink index.
SEO-specific features:
- Rank Tracker — Track up to 5,000 keywords with historical data (Advanced plan)
- Site Explorer — Backlink profile analysis with referring domains, anchor text, and link quality
- Keywords Explorer — Search volume, difficulty, and SERP analysis for keyword targeting
- Site Audit — Technical health monitoring with crawl scheduling and issue prioritization
- Competitive Analysis — Compare your site against competitors on backlinks, traffic, and rankings
- Report Builder — Custom PDF reports for clients or stakeholders
Side-by-Side Comparison
| Solution | Starting Price | Key Strength | Best For | Integration Options | Learning Curve |
|---|---|---|---|---|---|
| Power BI | $14/user/month | Enterprise integration depth | Analysts, Microsoft shops | Databases, Azure, files, online services, Power Platform | Moderate to steep |
| Tableau | $15 Viewer/month | Advanced analytics authoring | Data teams, interactive exploration | Databases, cloud apps, files, web data | Steep |
| Looker Studio Pro | Per-user (quote) | Google Workspace integration | Google-centric teams | BigQuery, GA, Ads, Sheets, SQL databases | Low to moderate |
| Geckoboard | $119/month | Live KPI dashboards | Operations, leadership visibility | Real-time cloud app connectors | Low |
| Databox | Free tier available | Marketing stack centralization | Marketing teams, SMBs | 120+ marketing and analytics tools | Low |
| AgencyAnalytics | $240/client/year | White-label client reporting | Marketing agencies | 85+ marketing integrations | Low |
| Semrush | Quote | SEO competitive intelligence | In-house SEO teams | SEO tools, GA, Search Console | Moderate |
| Ahrefs | £99/month | Backlink-focused reporting | SEO agencies, link builders | SEO tools, web analytics | Moderate |
How to Choose the Right KPI Report Software
Start by auditing your current reporting pain points—are stakeholders asking for the same metrics manually? Are you rebuilding dashboards every week? Do you have data in tools that don’t talk to each other? The right KPI software should eliminate those specific frustrations, not just add more dashboards.
Consider Your Data Sources
Integration capabilities determine whether a KPI tool will work for you. If your software can’t connect to your data, everything else is irrelevant—check for native connectors before evaluating features.
Common data source types to verify:
- CRM platforms — Salesforce, HubSpot, Pipedrive, Zoho
- Analytics and web data — Google Analytics, Adobe Analytics, Search Console
- Marketing tools — Google Ads, Facebook Ads, Mailchimp, LinkedIn
- Databases — MySQL, PostgreSQL, SQL Server, BigQuery, Snowflake
- Spreadsheets and files — Google Sheets, Excel, CSV uploads
Power BI and Tableau support the widest range of sources, including on-premises databases with gateways. Looker Studio Pro excels at Google-ecosystem data. AgencyAnalytics and Databox focus on marketing and advertising platforms. Match the tool to where your data lives.
Evaluate Customization Needs
Most KPI software sits somewhere between rigid templates and blank-canvas design. Templates get you reporting faster but limit flexibility. Custom dashboards give you control but require more setup time.
Customization factors to assess:
- Dashboard flexibility — Can you rearrange widgets, add custom metrics, and build from scratch?
- Metric selection — Does the tool support your specific KPIs, or only pre-built formulas?
- Branding options — Can you add your logo, colors, and remove vendor branding?
- Report formatting — Do you need PDFs, PowerPoint exports, or just live dashboards?
AgencyAnalytics and Geckoboard offer strong templated experiences with moderate customization. Power BI and Tableau give you full control but require more technical work. Looker Studio Pro balances ease of use with Google-native flexibility.
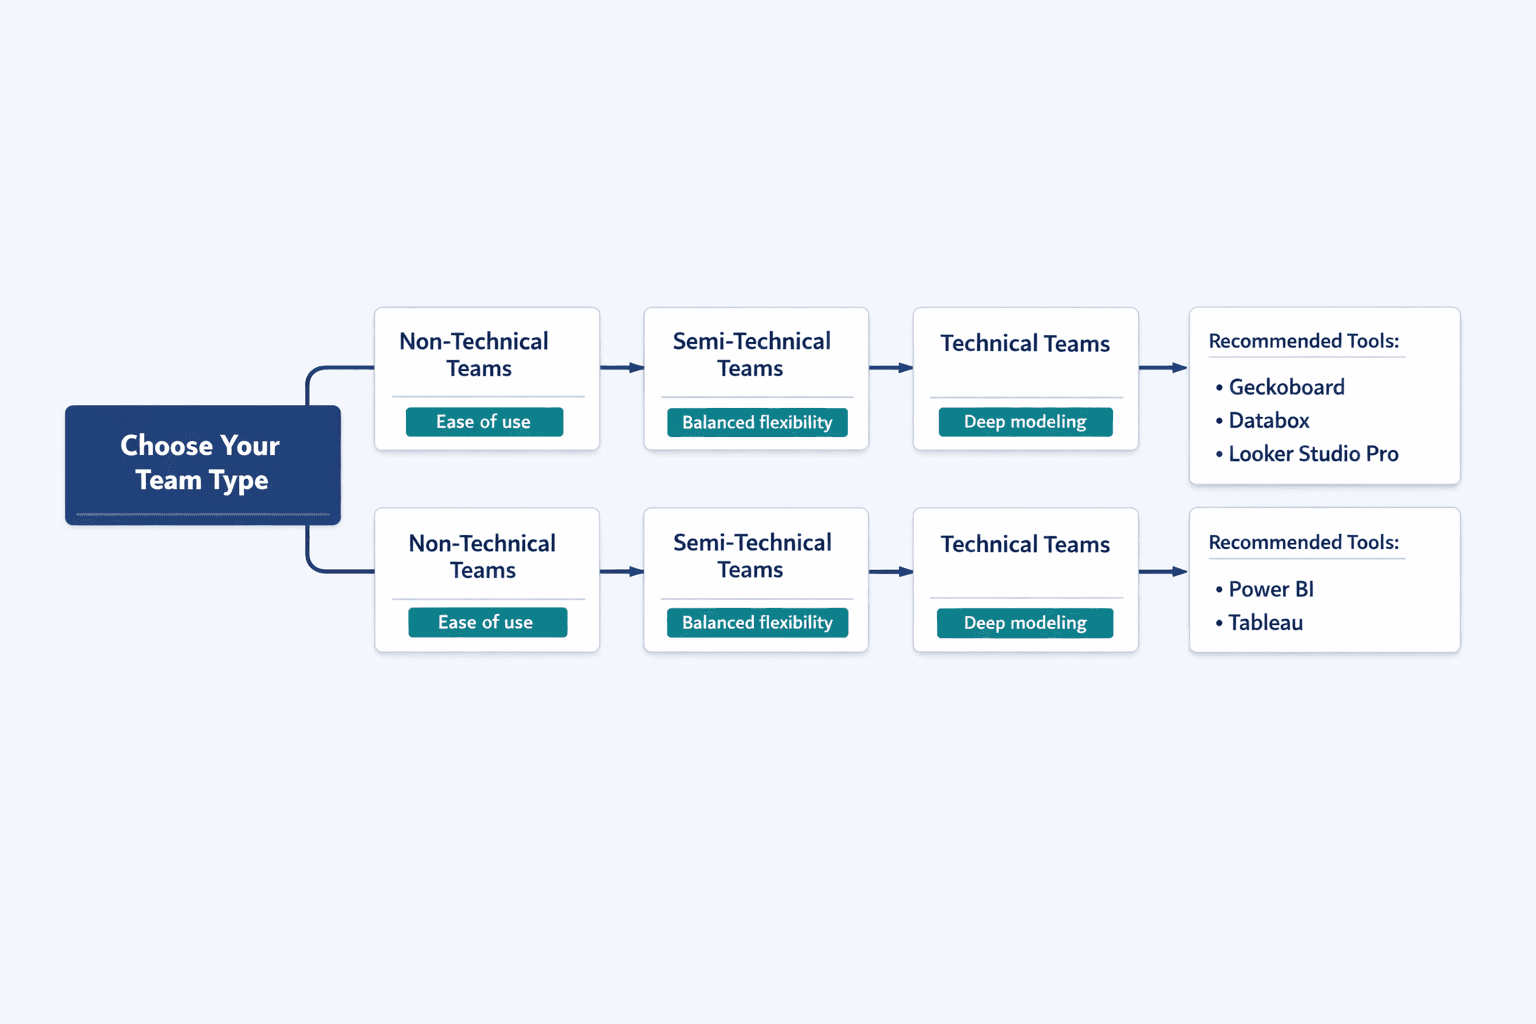
Assess Your Team’s Technical Level
Different tools assume different skill levels. Choosing software that’s too complex wastes time; choosing software that’s too simple limits what you can build.
Non-technical teams (executives, operations, customer success):
Geckoboard, Databox, and Looker Studio Pro work best—they prioritize ease of use, pre-built widgets, and sharing over deep data modeling.
Semi-technical teams (marketing managers, sales ops, product managers):
AgencyAnalytics, Looker Studio Pro, and Power BI with templates—you can build custom dashboards without writing SQL, but you have flexibility when needed.
Technical teams (analysts, data engineers, BI developers):
Power BI and Tableau—these tools assume you’re comfortable with data modeling, calculated fields, and performance optimization.
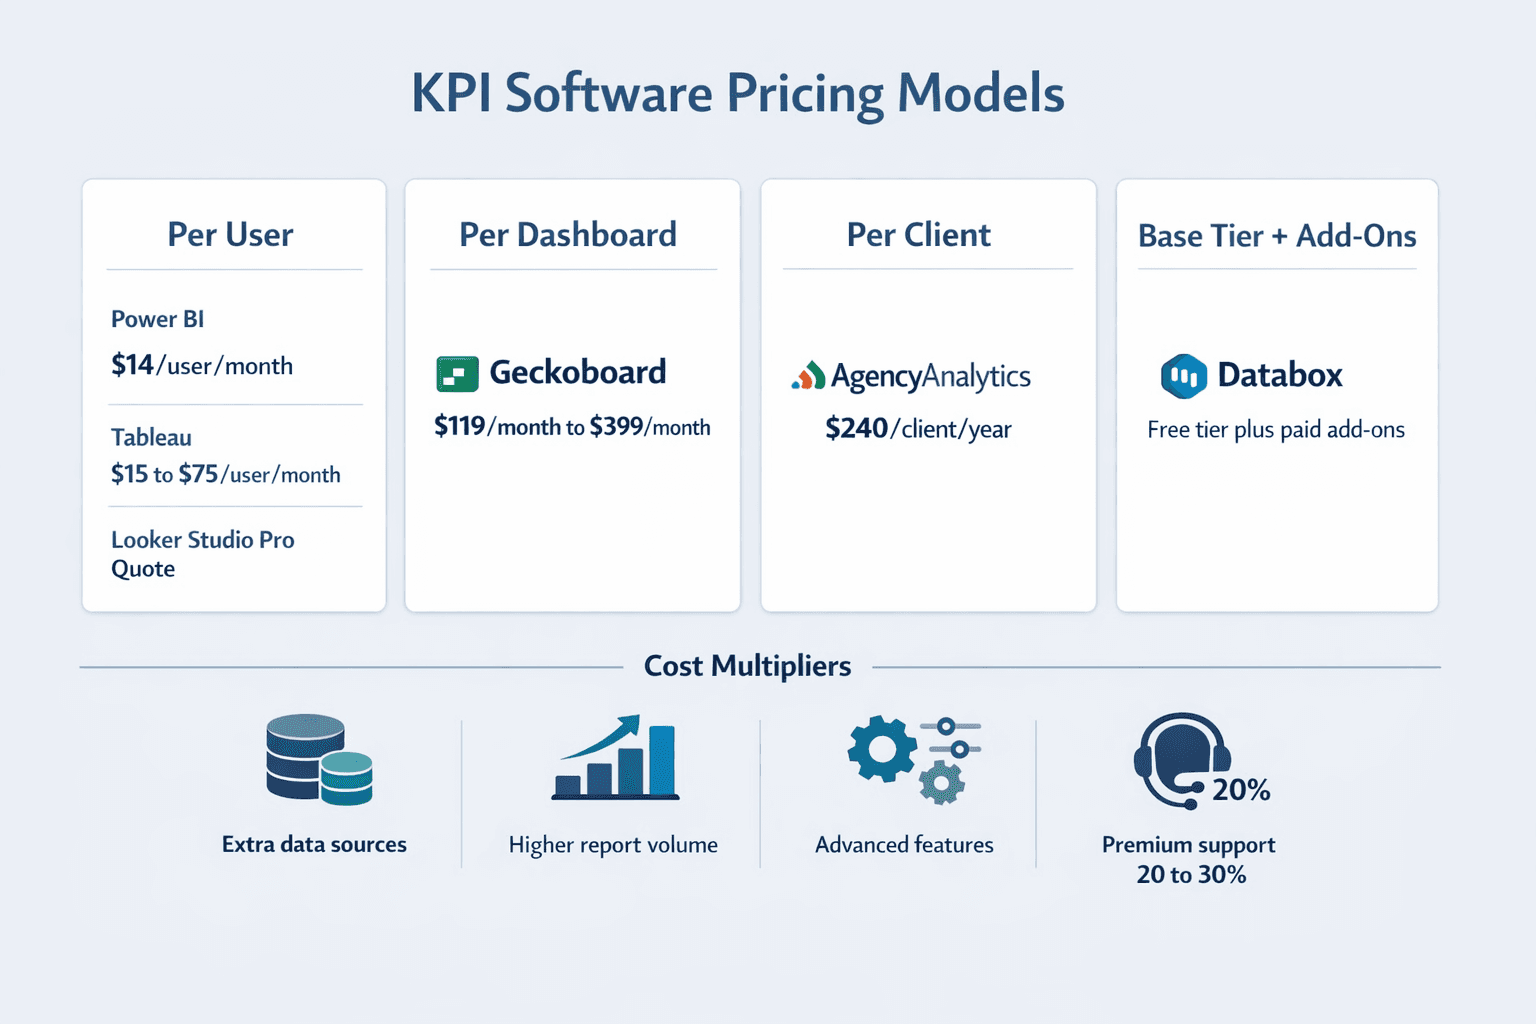
Budget Considerations
Advertised pricing is only part of the cost. Most KPI software charges based on multiple factors—user seats, data sources, report volume, and add-on features all affect your final bill.
Cost factors to consider:
- User seat model — Power BI, Tableau, and Looker Studio Pro charge per user; Geckoboard charges per dashboard and editor
- Data source limits — Databox and many tools charge extra for additional integrations beyond plan limits
- Report volume — Some platforms limit scheduled deliveries or dashboard views
- Advanced features — AI insights, white-labeling, and API access often require higher tiers
- Support level — Premium support and training can add 20-30% to annual costs
FAQ
What's the difference between KPI report software and business intelligence tools?
KPI report software focuses on tracking a specific set of metrics and delivering them to stakeholders—think executive dashboards, team performance monitors, and automated weekly snapshots. Business intelligence tools handle the full analytics lifecycle: data modeling, ad-hoc exploration, complex calculations, and enterprise governance. Geckoboard is KPI software. Tableau is a BI tool. Some platforms—like Power BI and Looker Studio Pro—work as both.
Can KPI report software integrate with my existing tools?
Usually yes, but connector depth and refresh method matter. Most modern KPI software supports cloud analytics, advertising, databases, and spreadsheets—Google Analytics, Salesforce, MySQL, and Excel are nearly universal. Less common sources may require API connectors, custom integrations, or manual uploads.
Common integration types across solutions:
- Direct cloud connectors — One-click setup for SaaS tools
- Database connectors — SQL-based access to your data warehouse
- API integrations — Custom data pulls via REST or GraphQL
- File uploads — Manual CSV or Excel imports
Check whether the tool supports your specific platforms and whether it offers real-time updates, scheduled refresh, or manual sync.
How much does KPI report software typically cost?
Entry-level KPI software starts around $10-20 per user per month for basic dashboarding—Power BI Pro is $14/user/month paid yearly, Looker Studio Pro requires a quote, and Databox has a free tier. Mid-tier platforms with advanced automation and integrations run $100-400 per month. Enterprise BI tools like Tableau can exceed $1,000/month when you add Creator licenses and deployment infrastructure.
Agency and marketing-focused platforms use different pricing models. AgencyAnalytics charges $20 per client per month billed annually. Geckoboard’s dashboard-based pricing starts at $119/month. SEO tools like Ahrefs run £99-359/month depending on tracked keyword limits. Always factor in add-on costs—extra data sources, users, and advanced features can double your baseline price.
Do I need separate software for SEO business reports?
It depends on how deep your SEO work goes. If you only need Google Analytics and Search Console data, Looker Studio Pro or Databox work fine—they connect natively and let you build custom dashboards. But if you track keyword rankings, monitor backlink profiles, run technical audits, or compare against competitors, general KPI software won’t give you that data.
AgencyAnalytics is purpose-built for agencies with white-label reporting, rank tracking, and client portals. Ahrefs provides the deepest backlink database and competitive intelligence. Semrush offers the broadest SEO toolset with reporting as one component. Use specialized software if SEO reporting is a core business function, not an occasional check-in.
Can I automate KPI report delivery?
Yes—automated delivery is a core feature across nearly all modern KPI software. The depth varies: some tools just email PDFs on a schedule, while others push reports to Slack, Teams, or Google Chat with interactive elements.
Common automation features:
- Scheduled email reports — Daily, weekly, or monthly PDF snapshots
- Slack and Teams integration — Push dashboards directly into team channels
- Alert notifications — Get notified when KPIs cross thresholds
- Mobile push notifications — Receive updates on iOS or Android apps
Looker Studio Pro allows up to 200 delivery schedules per report and supports Google Chat delivery. Geckoboard includes snapshots for Slack, Teams, and email. AgencyAnalytics automates client reports out of the box. Check whether automation is included in base plans or locked behind higher tiers.