Business Report Example (With Full Template)
Business reports turn data into decisions. This guide covers structure, examples, and a fill-in template—from executive summaries to recommendations.
Quick Verdict
A business report is a formal document that presents information, analysis, and recommendations to help organizations make informed decisions. It’s the bridge between raw data and actionable strategy—whether you’re tracking quarterly sales, evaluating a marketing campaign, or assessing operational efficiency.
Business reports matter because they create accountability, document progress, and support decision-making. They turn scattered information into a clear narrative that stakeholders can actually use. Without them, organizations fly blind—making decisions based on gut feel instead of evidence.
This guide covers what business reports are, how they differ from other documents, and when to use them. You’ll see two complete examples and get a fill-in-the-blank template you can adapt for your own reporting needs.
What Is a Business Report?
A business report is a formal document that presents information, analysis, and recommendations to support organizational decision-making. Unlike memos or emails, business reports are structured, evidence-based documents designed for long-term reference.
What makes something a business report instead of just a document? Three things: it’s organized around specific questions or objectives, it presents data systematically (not anecdotally), and it includes clear conclusions or recommendations. A business report doesn’t just say “sales were down”—it explains why, what it means, and what to do about it.
Every business report contains:
- Executive summary - A 1-page overview of purpose, findings, and recommendations
- Findings - The data, evidence, and analysis that answer your research questions
- Data analysis - Charts, tables, and interpretation showing what the numbers mean
- Conclusions - What the findings tell you about the situation
- Recommendations - Specific actions the organization should take based on the evidence
Organizations use business reports whenever decisions need documentation and buy-in. That might be quarterly performance reviews, project retrospectives, feasibility studies for new initiatives, or incident analyses after something goes wrong.
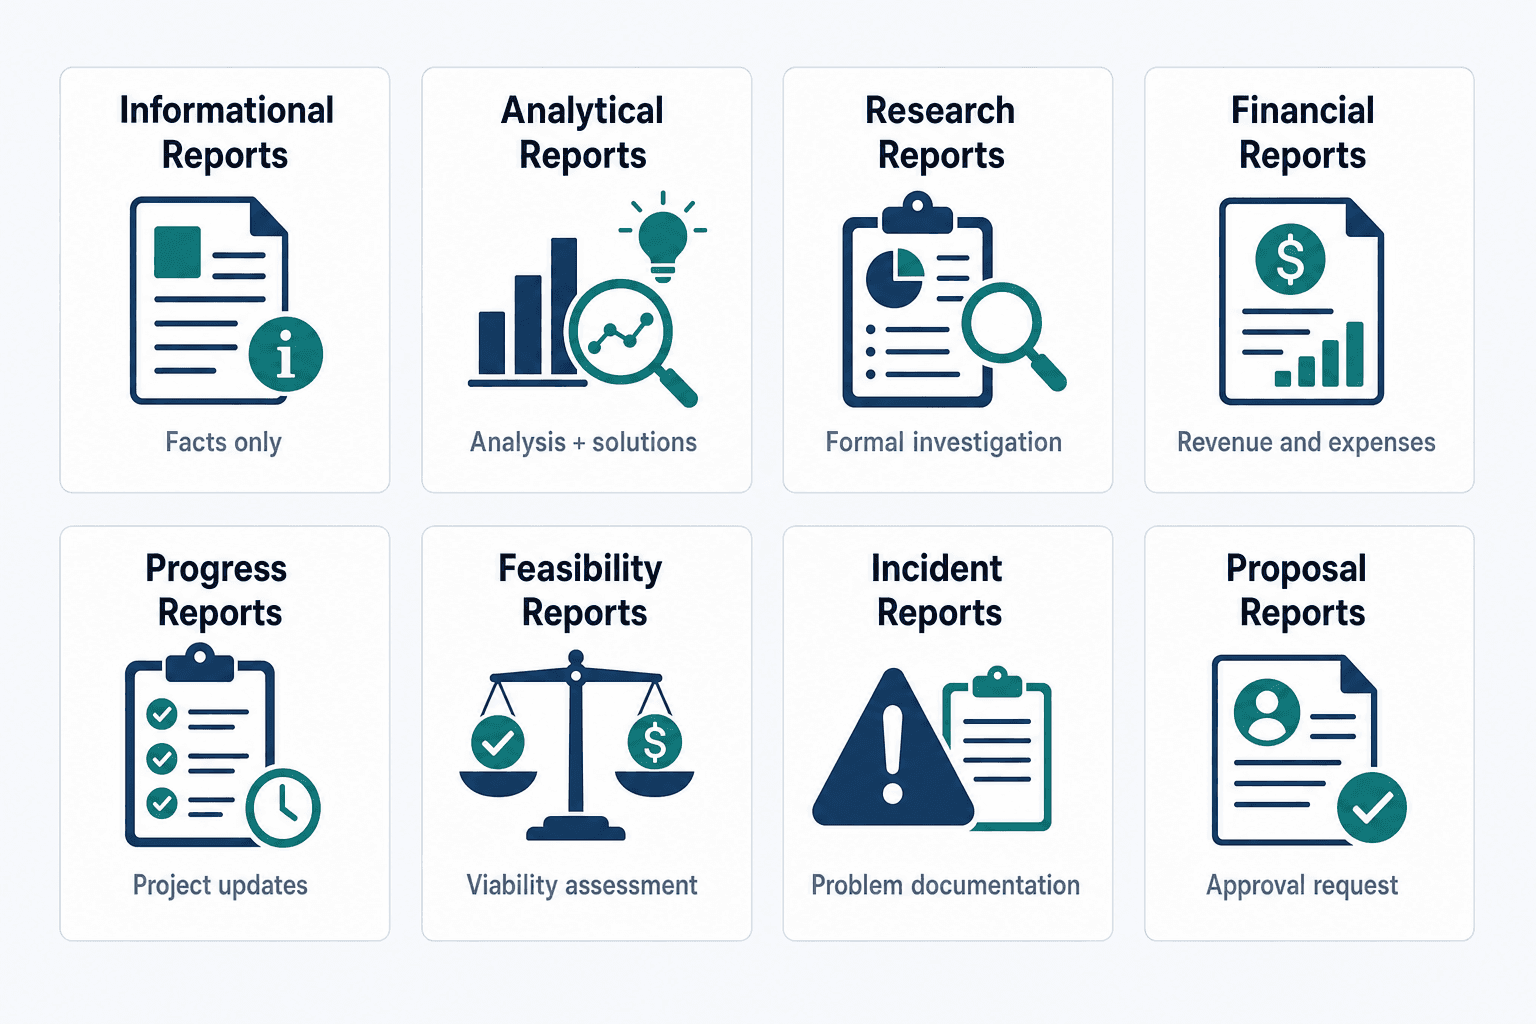
Types of Business Reports
Different situations call for different report types:
- Informational reports - Present facts without analysis or recommendations (meeting minutes, trip reports)
- Analytical reports - Examine problems and recommend solutions based on data
- Research reports - Investigate specific questions through formal research methods
- Financial reports - Track revenue, expenses, cash flow, and financial performance
- Progress reports - Update stakeholders on past, present, and future tasks for ongoing projects
- Feasibility reports - Evaluate whether a proposed project or initiative is viable
- Incident reports - Document what went wrong, why it happened, and how to prevent recurrence
- Proposal reports - Make a case for funding, resources, or approval of a new initiative
Key Elements of a Business Report
A complete business report includes these structural components:
- Title page - Report title, author, recipient, date, and organization
- Table of contents - Section headings with page numbers for easy navigation
- Executive summary - Standalone overview that may be the only section executives read
- Introduction - Purpose, scope, methodology, and background context
- Findings/Body - The main content presenting data, analysis, and evidence
- Conclusions - Synthesis of what the findings mean for the organization
- Recommendations - Specific, actionable next steps
- Appendices - Supporting materials like raw data, detailed charts, or supplementary research
- References - Citations for external sources using appropriate format
| Element | Purpose | Typical Length |
|---|---|---|
| Executive Summary | Standalone overview for decision-makers | 1 page |
| Introduction | Set context and explain methodology | 1-2 pages |
| Findings/Body | Present data and analysis | 5-15 pages |
| Conclusions | Synthesize what findings mean | 1-2 pages |
| Recommendations | Provide actionable next steps | 1 page |
Business Report Example
Here are two complete examples showing how business reports work in practice. The first is a detailed quarterly performance report. The second is a condensed marketing campaign analysis.
Example: Quarterly Sales Performance Report
This report analyzes Q1 2026 sales performance for a fictional mid-sized software company, identifying trends and recommending strategic adjustments.
Executive Summary (Example Section)
Purpose: This report analyzes Q1 2026 sales performance for CloudTech Solutions to identify trends, assess goal achievement, and recommend strategic adjustments for Q2.
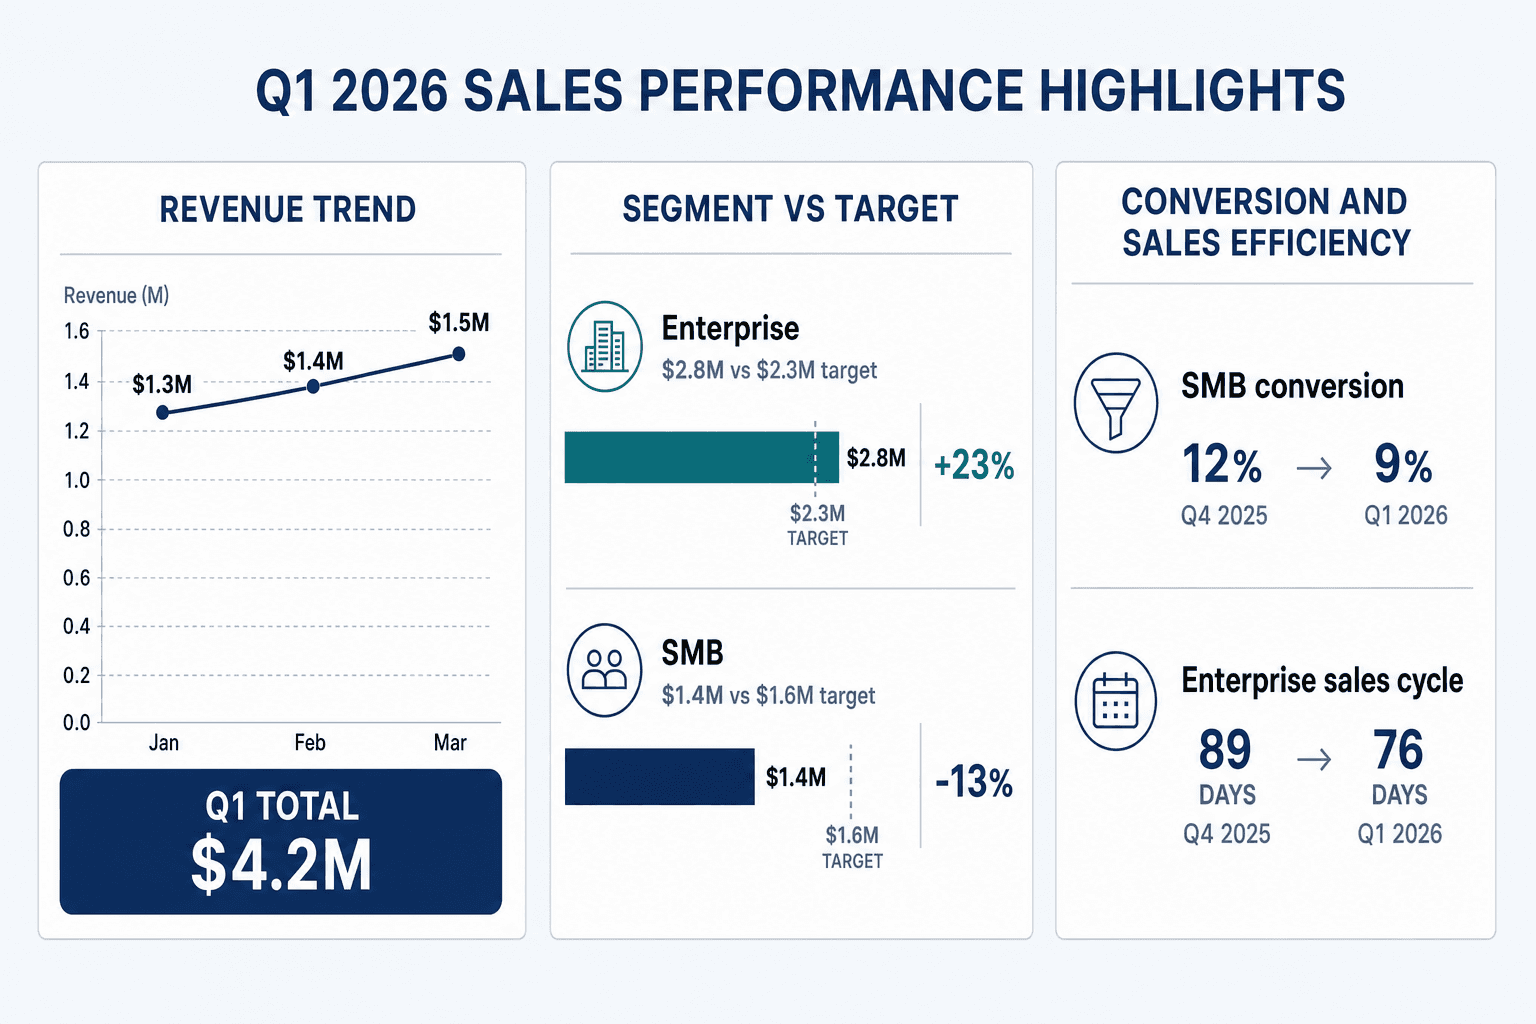
Key Findings: Q1 revenue reached $4.2M, representing 105% of target and 18% year-over-year growth. Enterprise segment exceeded projections by 23%, driven by three major contract wins. However, SMB segment underperformed at 87% of target, with conversion rates declining from 12% to 9%.
Primary Recommendation: Reallocate 15% of SMB marketing budget to enterprise pipeline development while implementing revised onboarding process to improve SMB conversion rates. Projected impact: $300K additional Q2 revenue.
Introduction (Example Section)
Purpose and Scope
This report examines CloudTech Solutions’ Q1 2026 sales performance across all customer segments, channels, and product lines. The analysis covers January 1 through March 31, 2026, comparing results against annual targets and Q1 2025 performance.
Methodology
Data was compiled from Salesforce CRM (pipeline and conversion metrics), Stripe (revenue and payment data), and Google Analytics (web traffic and lead sources). Financial figures were verified against accounting records in QuickBooks. Customer interviews were conducted with 15 enterprise clients and 25 SMB accounts to understand purchase drivers and friction points.
Findings Section (Example Section)
Overall Revenue Performance
Q1 2026 generated $4.2M in revenue, exceeding the $4.0M target by 5% and showing 18% growth versus Q1 2025’s $3.6M. Monthly breakdown showed consistent performance: January $1.3M, February $1.4M, March $1.5M—indicating healthy momentum rather than end-of-quarter concentration.
Enterprise Segment: Strong Overperformance
Enterprise segment (50+ employees) delivered $2.8M, or 123% of the $2.3M target. Three contracts over $200K each—Acme Corp ($340K), TechGiant Inc ($285K), and FinanceHub ($220K)—drove this outperformance. Average deal size increased from $42K in Q1 2025 to $56K in Q1 2026, a 33% improvement. Sales cycle shortened from 89 days to 76 days.
SMB Segment: Concerning Underperformance
SMB segment (5-49 employees) generated $1.4M versus a $1.6M target, missing by 13%. Lead volume held steady at 2,400 qualified leads, but conversion rate dropped from 12% in Q4 2025 to 9% in Q1 2026. Customer interviews revealed that revised pricing structure implemented in December confused buyers, and new 30-day trial (down from 60 days) didn’t provide enough evaluation time.
| Segment | Q1 Target | Q1 Actual | vs Target | YoY Growth |
|---|---|---|---|---|
| Enterprise | $2.3M | $2.8M | +23% | +31% |
| SMB | $1.6M | $1.4M | -13% | +8% |
| Self-Service | $0.1M | $0.1M | Even | +5% |
| Total | $4.0M | $4.2M | +5% | +18% |
Channel Performance
Direct sales (78% of revenue) continued to dominate, but partner channel showed promise with $620K revenue—140% of target. Two new partnerships with IT consulting firms contributed $380K combined. Self-service web signups remained flat at $100K despite increased marketing spend, suggesting pricing or messaging issues.
Conclusions (Example Section)
Strategic Position is Strong but Bifurcated
CloudTech’s Q1 performance demonstrates strong product-market fit in the enterprise segment, where larger deal sizes, faster sales cycles, and high satisfaction scores indicate we’ve found our sweet spot. The 33% increase in average deal size suggests customers see real value at scale.
However, SMB performance signals a mismatch between our current go-to-market approach and what smaller customers need. The conversion rate decline correlates directly with pricing and trial changes made in Q4, and customer feedback confirms these changes created friction rather than improving sales efficiency.
Recommendations (Example Section)
Reallocate 15% of SMB marketing budget ($45K) to enterprise pipeline development - Double down on what’s working. Use these funds to hire a second enterprise sales development rep and expand outbound prospecting to similar verticals where we’ve seen success.
Restore 60-day trial period for SMB segment - Customer interviews showed decisively that 30 days isn’t enough evaluation time for teams of 5-20 people. Revert to 60-day trial by April 15 and measure impact on Q2 conversion rates.
Simplify SMB pricing structure - Current 4-tier pricing confuses buyers. Consolidate to 2 tiers (Starter and Professional) with clear feature differentiation. Implement by May 1 to capture mid-quarter buying window.
Formalize partner channel program - Two consulting partnerships drove $380K—this model works. Hire a channel manager to recruit 5 additional partners and create co-marketing materials by June 30.
Example: Marketing Campaign Analysis Report
Executive Summary
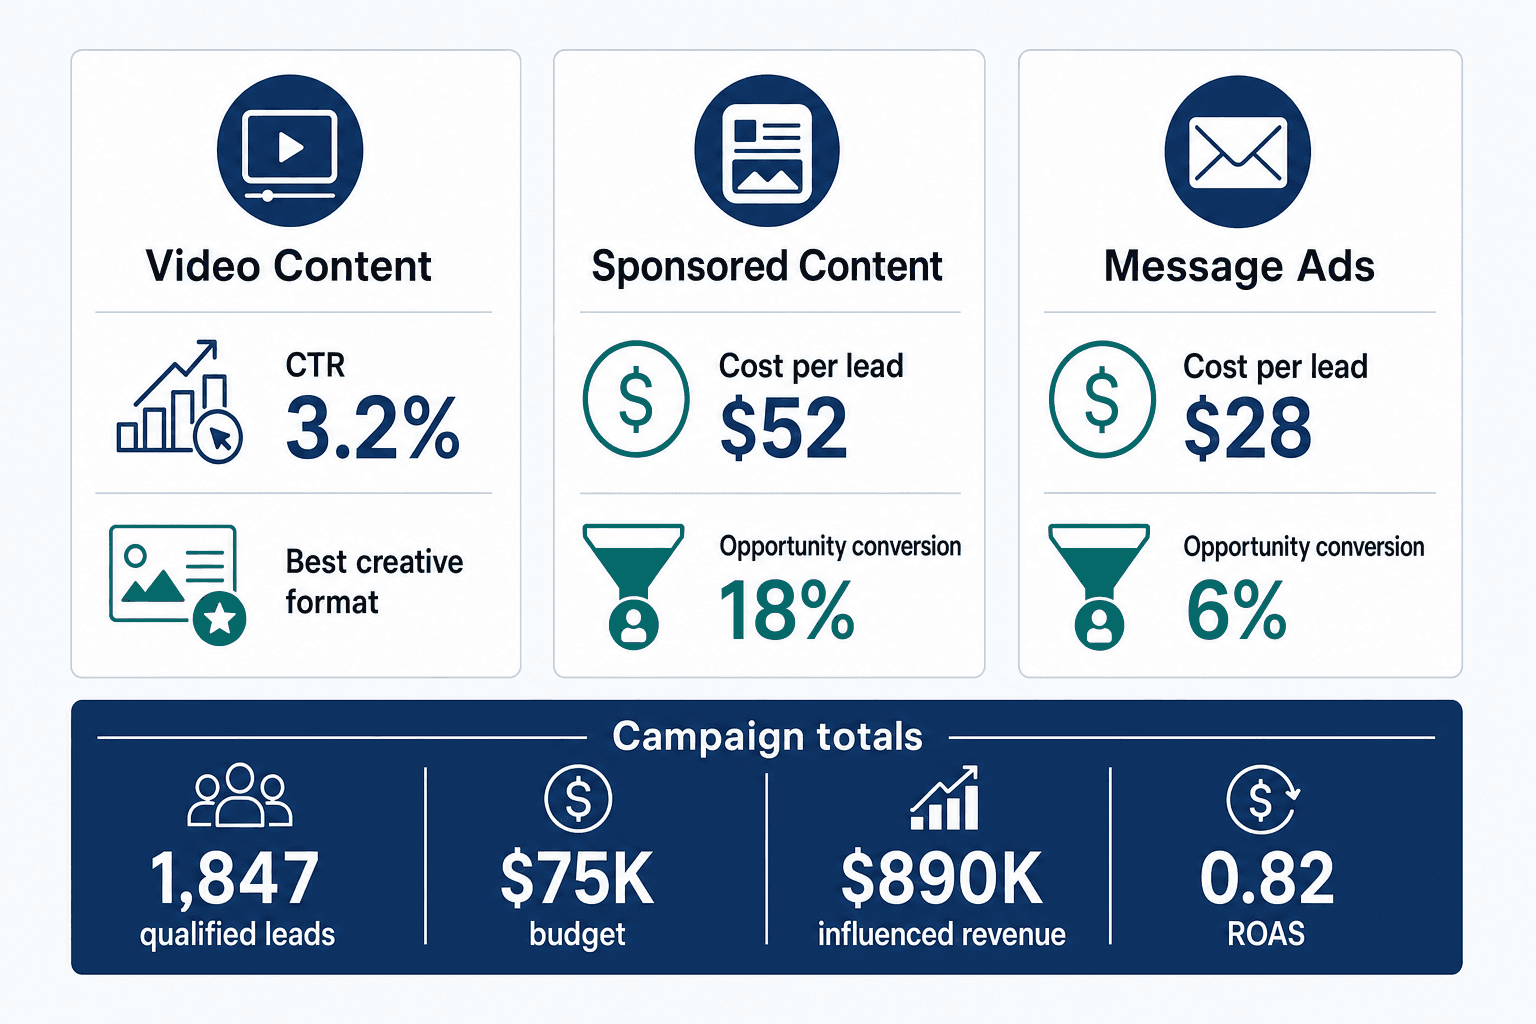
This report evaluates the Q4 2025 “Scale Faster” LinkedIn campaign, which ran October 1 - December 31, 2025 with a $75K budget. The campaign generated 1,847 qualified leads at $41/lead and influenced $890K in closed revenue. While lead volume met targets, conversion to opportunity underperformed expectations at 11% versus projected 18%.
Introduction and Methodology
The campaign targeted VP and Director-level tech leaders at Series A-C SaaS companies through LinkedIn Sponsored Content, Message Ads, and Thought Leader Ads. Creative featured 8 video testimonials and 4 downloadable guides. Performance data was pulled from LinkedIn Campaign Manager, Salesforce (opportunity attribution), and Google Analytics (website behavior post-click).
Key Findings
Lead generation exceeded the 1,600 target by 15%. Video content dramatically outperformed static ads (CTR 3.2% vs 1.1%), and Message Ads delivered the lowest cost per lead at $28 versus Sponsored Content’s $52. However, lead quality varied significantly—Sponsored Content leads converted to opportunities at 18%, while Message Ad leads converted at only 6%.
The campaign influenced $890K in closed revenue with 23 attributed wins. Most valuable cohort was Director-level leads from Series B companies, which showed 24% opportunity conversion and $61K average deal size. The campaign maintained consistent 0.82 ROAS across the quarter, with stronger performance in November when we focused creative exclusively on case studies.
Conclusions
“Scale Faster” validated video testimonial content and Series B company targeting while revealing that volume-focused tactics (Message Ads) sacrifice lead quality. The campaign successfully established CloudTech’s brand among the target persona, evidenced by direct search traffic increasing 34% during the campaign period.
Recommendations
For Q1 2026 campaigns: (1) Shift 60% of budget to video content on Sponsored Content exclusively—avoid Message Ads despite lower cost, (2) Narrow targeting to Director+ at Series B companies only, and (3) Implement lead scoring in Salesforce to prioritize Sponsored Content leads for immediate sales follow-up while nurturing Message Ad leads through email sequences.
Business Report Template
Use this template to structure your own business reports. Copy the structure below and replace bracketed placeholders with your content.
Complete Template Structure
Title Page
Include these five elements:
- Report title (be specific—“Q1 2026 Sales Performance Report” not “Sales Report”)
- Prepared for: [Name and title of primary audience]
- Prepared by: [Your name and title]
- Date: [Report completion date]
- Company/Organization name
Executive Summary
[State the report’s purpose in one sentence]. [Summarize 2-3 key findings with specific numbers or evidence]. [State your primary recommendation or conclusion].
Keep this to one page maximum. Write it last, after you’ve completed the rest of the report. It should stand alone—readers who only read this section should understand what happened and what to do.
Table of Contents
List all section headings with page numbers. If your report is under 5 pages, you can skip this.
Introduction
Break your introduction into three clear subsections:
Purpose: [Explain in 2-3 sentences why this report exists and what question it answers. Example: “This report evaluates our Q2 marketing campaigns to determine which channels drove qualified leads and influenced revenue. The analysis will inform Q3 budget allocation.”]
Scope: [Define what’s included and excluded, time period covered, data sources used. Example: “Analysis covers April 1 - June 30, 2026, including all paid advertising, organic social, and email campaigns. Sales team activity and PR are excluded from this analysis.”]
Methodology: [Explain how you gathered and analyzed information. Example: “Data was compiled from Google Analytics, LinkedIn Campaign Manager, and Salesforce CRM. Attribution uses last-touch model. Customer surveys were conducted with 45 respondents.”]
Findings/Body
Structure your findings with clear subheadings. Use this format for each major finding:
[Finding 1 Heading]: [Present the data, evidence, and analysis for this finding. Include specific numbers, comparisons, and context. Use tables or charts where they clarify complex information. Explain what the data shows and why it matters.]
[Finding 2 Heading]: [Present the data, evidence, and analysis for this finding. Support claims with evidence from your research. Compare against benchmarks, targets, or previous periods where relevant.]
[Finding 3 Heading]: [Continue with additional findings as needed. Each finding should connect to your report’s purpose and help answer your research questions.]
Conclusions
[Synthesize your findings into 2-4 key takeaways. What do the findings mean when viewed together? What patterns or themes emerge? Example: “Performance data indicates our enterprise focus is working while SMB strategies need revision.”]
[State what the evidence means for the organization’s goals, strategy, or operations. Connect back to the purpose stated in your introduction. Avoid introducing new information—conclusions should flow logically from findings presented earlier.]
Recommendations
Present specific, actionable recommendations in numbered format:
- [Recommendation with clear action and rationale. Example: “Increase enterprise sales team from 3 to 5 reps by Q3. Current pipeline volume ($4.2M) exceeds team capacity, resulting in 45-day response times that risk deal loss.”]
- [Recommendation with clear action and rationale. Include timeline, responsible party, or resource requirements where applicable.]
- [Recommendation with clear action and rationale. Priority order matters—list highest-impact or most urgent recommendations first.]
Pro tip: Frame recommendations with the reader’s decision context in mind. Instead of “Improve website speed,” write “Reduce homepage load time to under 2 seconds by July 15 to recover 15% of mobile visitors currently abandoning due to slow loads.”
Appendices
List supporting materials that don’t fit in the main report but provide important detail:
- Appendix A: Raw survey data
- Appendix B: Detailed financial calculations
- Appendix C: Additional charts and graphs
- Appendix D: Interview transcripts or quotes
References
Cite all external sources using appropriate citation format (APA, MLA, Chicago, or your organization’s standard). Include:
- Industry reports and statistics
- Research studies referenced
- Competitor analysis sources
- Regulatory guidance or standards cited
How to Write a Business Report
Writing a business report is systematic work—not inspiration. Follow a structured process from planning through final review to create reports that actually get read and used.
Step 1: Define Purpose and Audience
Before writing anything, get clarity on objectives and readers. A report written for your CEO needs different content and length than one for your project team—yet both could analyze the same data.
Answer these questions before you start:
- Who will read this report? What’s their role and knowledge level?
- What decision will this report inform or support?
- What specific questions must the report answer?
- What’s the deadline? How much time do I have for research and writing?
- Are there format or length requirements I need to follow?
Step 2: Research and Gather Data
Collect the information you’ll need to answer your research questions. Good business reports use multiple data sources to build credible findings.
Common data gathering approaches:
- Interviews - Talk to stakeholders, customers, or subject matter experts
- Surveys - Collect quantitative data from larger sample sizes
- Financial records - Pull from accounting systems, CRM, or analytics platforms
- Industry research - Reference published reports, benchmarks, or competitive intelligence
- Internal databases - Access sales data, customer records, or operational metrics
- Observation - Watch processes, user behavior, or team workflows firsthand
Step 3: Organize Your Information
Structure findings logically before writing. How you organize content shapes whether readers can follow your argument and accept your conclusions.
Choose the organizational strategy that fits your content:
- Chronological - Present events or data in time order (useful for progress reports, incident analyses)
- Categorical - Group by theme or type (useful when analyzing multiple products, markets, or departments)
- Problem-solution - State problem, explore causes, propose solutions (useful for analytical reports)
- Compare-contrast - Present options side-by-side (useful for feasibility studies or vendor evaluations)
- Order of importance - Start with most critical findings (useful when executives will skim)
Step 4: Write the First Draft
Draft efficiently by writing sections in logical order—not the order they’ll appear in the final report.
Write your first draft following these steps:
- Start with findings/body sections (not the introduction): You can’t introduce something you haven’t written yet. Draft the main content first so you know what you’re introducing.
- Present data with clear interpretation: Don’t just dump numbers. Explain what they mean. “Revenue declined 8%” is data. “Revenue declined 8% due to seasonal buying patterns, consistent with previous Q1 performance” is analysis.
- Use tables and charts for complex data: If you’re presenting 5+ numbers, a table usually works better than paragraph text. Present data visually where it clarifies understanding.
- Support claims with evidence: Every conclusion should trace back to data presented earlier. If you recommend hiring two more reps, your findings section should document the workload or opportunity data that justifies it.
- Write introduction after body: Once your findings are drafted, write the introduction to set them up properly. State purpose, scope, and methodology clearly.
- Create executive summary last: The summary synthesizes the entire report. You can’t write it first—you don’t know what you’re summarizing yet.
- Maintain objective tone throughout: Business reports present evidence, not opinions. Write “Customer satisfaction scores declined from 4.2 to 3.8” instead of “Customers seem unhappy.”
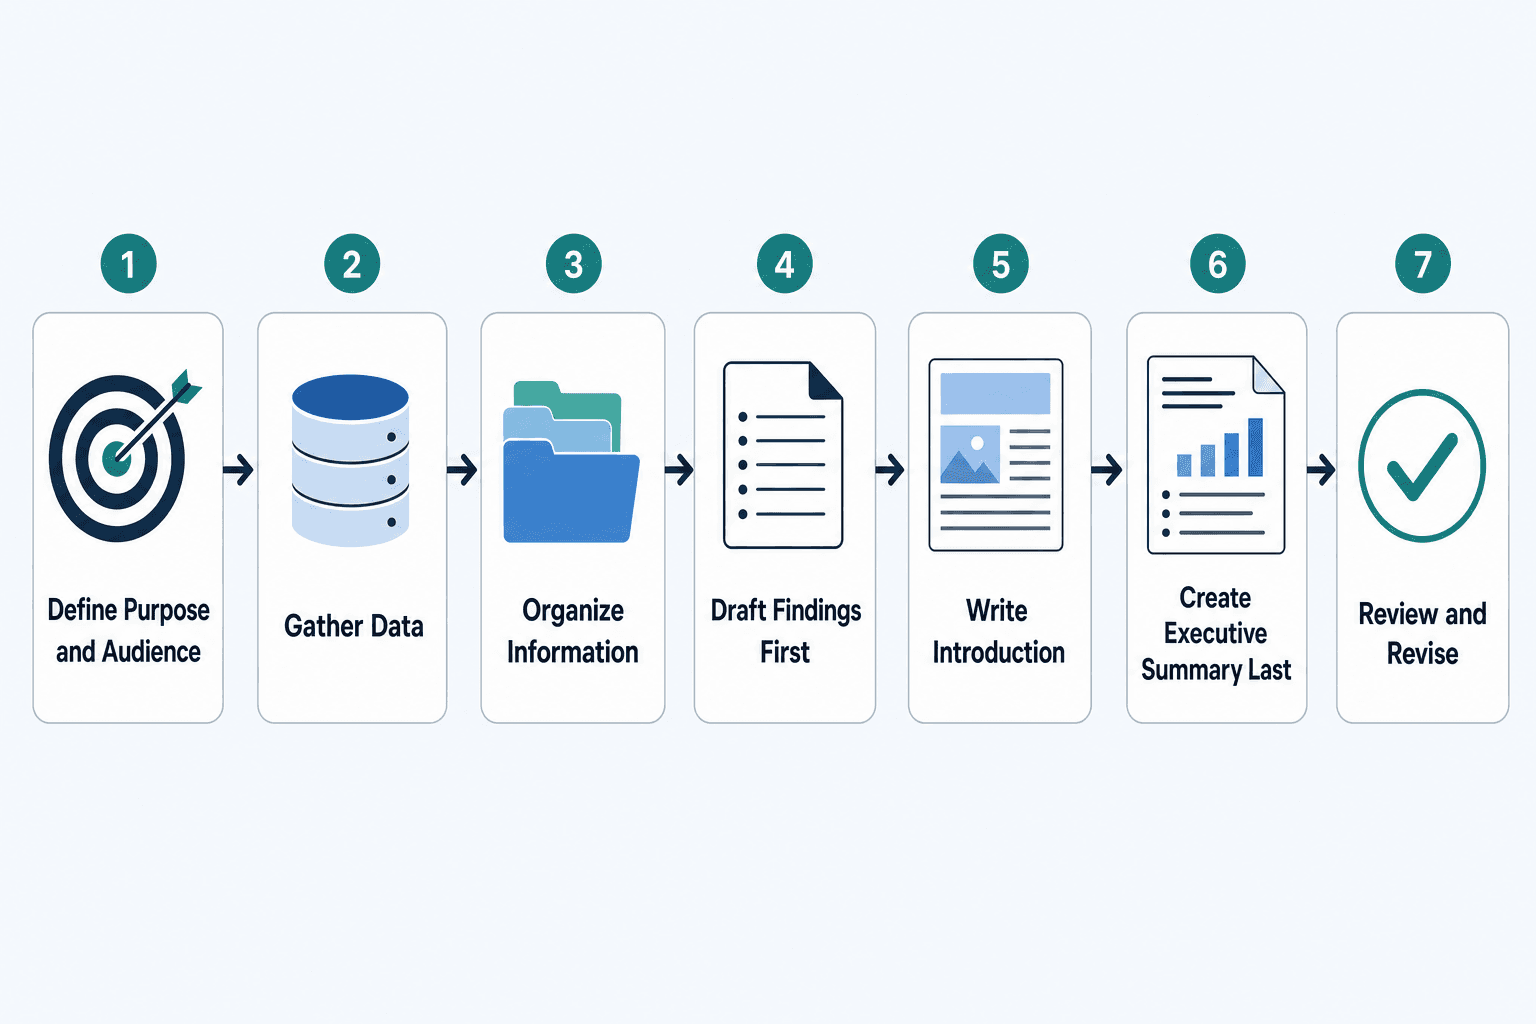
Step 5: Review and Revise
Revision matters more than most people think. First drafts are for getting ideas down—revision is where clarity happens.
Check these revision points:
- Accuracy of data - Verify every number, date, and citation is correct
- Logical flow - Does each section connect smoothly to the next?
- Clarity of recommendations - Can a reader immediately understand what action to take?
- Grammar and formatting - Fix typos, inconsistent heading styles, broken tables
- Consistency of terminology - Use the same terms throughout (don’t switch between “clients,” “customers,” and “accounts”)
- Completeness of citations - Are all external sources properly cited?
- Executive summary alignment - Does your summary accurately reflect the report’s content?
- Visual presentation quality - Are charts labeled clearly? Tables formatted consistently?
Business Report Format and Style Guidelines
Professional formatting makes reports easier to read and more credible. Clear layout and plain language signal that your work is thorough and trustworthy.
Formatting Requirements
Standard business report formatting:
- Font type and size - Use professional fonts like Calibri, Arial, or Times New Roman in 12-point for body text
- Margins - Set 1-inch margins on all sides
- Line spacing - Use 1.5 or double spacing for body text
- Heading hierarchy - Use consistent styles for H1, H2, H3 headings (larger size, bold, or different color)
- Page numbering - Number pages starting with the introduction (title page and table of contents typically unnumbered)
- Table and figure captions - Label all visuals as “Table 1” or “Figure 2” with descriptive titles
- Citation style - Follow APA, MLA, Chicago, or your organization’s standard consistently
- File format - Save as PDF for distribution to preserve formatting across systems
Writing Style Best Practices
Write clearly and professionally:
- Use clear, concise language - Shorter sentences and common words improve understanding
- Maintain formal professional tone - Avoid slang, humor, or overly casual phrasing
- Write in third person - Use “the team analyzed” instead of “we analyzed”
- Use active voice where possible - “The report recommends” reads better than “it is recommended by this report”
- Avoid jargon or define technical terms - If your audience doesn’t work in your department, explain specialized language
- Use transitions between sections - Connect ideas with phrases like “building on this finding” or “in contrast”
- Be objective and evidence-based - State facts, not opinions; support claims with data
- Front-load important information - Start paragraphs with the main point, then add supporting detail
Visual Presentation Tips
Well-designed visuals make complex data easier to understand. Charts and tables should clarify, not confuse.
Follow these guidelines for professional visuals:
- Label all axes and columns - Never assume readers will figure out what numbers represent
- Use consistent color schemes - Choose 2-4 colors and use them the same way throughout
- Reference visuals in body text - Write “as shown in Figure 3” so readers know when to look at charts
- Place visuals near relevant discussion - Don’t make readers flip pages to connect text and graphics
- Keep designs simple and readable - Avoid 3D effects, unnecessary gridlines, or cluttered legends
- Provide source citations - Note where data came from below each table or chart
Common Business Report Mistakes to Avoid
Watch out for these frequent errors that weaken business reports:
- Burying the main point - Don’t hide recommendations in dense paragraphs. State conclusions clearly upfront.
- Lack of clear structure - Reports without logical section breaks are hard to navigate and skim.
- Insufficient data support - Recommendations need evidence. Don’t ask for budget or headcount without showing why.
- Ignoring audience needs - Writing for yourself instead of your readers results in reports that don’t get used.
- Poor executive summary - If your summary just says “see full report for details,” it’s not doing its job.
- Missing recommendations - Analytical reports should end with clear next steps, not just observations.
- Inconsistent formatting - Switching heading styles, fonts, or numbering schemes looks unprofessional.
- Grammatical errors - Typos and mistakes undermine credibility, even if the analysis is solid.
- Overly complex language - Using jargon or academic phrasing doesn’t make you sound smarter—it makes you harder to understand.
- Failure to proofread - Always review your work before submitting. Have someone else read it if possible.
Frequently Asked Questions
How long should a business report be?
Report length depends entirely on purpose and audience. Most business reports run 10-20 pages—long enough to present thorough analysis but short enough that busy readers will actually finish them. Some contexts require different lengths: formal CDC reports are capped at 1,400 words, while comprehensive annual reports can exceed 50 pages. Short reports (5-10 pages) work for simple progress updates or focused analytical questions. Longer reports (20-50+ pages) fit complex research projects, comprehensive feasibility studies, or regulatory filings. The key is matching length to content—don’t pad reports to hit arbitrary page counts, and don’t cut necessary detail to stay artificially brief.
What is the difference between a business report and a business plan?
Business reports analyze past or present data to inform current decisions. Business plans outline future strategy and operations for new or growing ventures. Reports answer “what happened and why” while plans answer “what we’ll do and how.” Reports present findings, conclusions, and recommendations based on evidence. Plans present vision, strategy, market analysis, financial projections, and operational roadmaps. You write a report after gathering data; you write a plan before launching something new.
Do all business reports need an executive summary?
Formal business reports should include executive summaries, especially if they’re longer than 5 pages or going to senior leadership. The executive summary may be the only section busy executives read, so it’s critical for decision-making. You can skip the executive summary for short informal reports (under 3 pages), internal team updates where everyone already knows the context, or when organizational norms don’t require one. But if you’re unsure, include it—having a summary never hurts, while missing one can frustrate readers who need the quick version.
What software should I use to create a business report?
Most organizations use Microsoft Word for business reports—it’s standard, handles long documents well, and everyone can open the files. Google Docs works fine if you’re collaborating in real-time or working from different devices. Apple Pages is solid for Mac users. For data-heavy reports, create charts and analysis in Excel or Google Sheets, then paste them into your Word document with proper formatting. For reports requiring design polish or interactive elements, consider tools like Adobe InDesign or Canva, but those are overkill for standard internal reporting.
How often should business reports be created?
Report frequency depends on report type and organizational needs. Financial reports typically run quarterly or monthly—tracking revenue, expenses, and cash flow on regular cycles. Progress reports update stakeholders monthly or bi-weekly on active projects. Performance reviews happen quarterly or annually, reviewing goals and KPIs against targets. Analytical reports are created ad-hoc when specific questions arise or decisions need data support. Incident reports are written immediately after significant problems occur. The right frequency is whatever keeps stakeholders informed without creating unnecessary documentation burden.