Business Report Format: The Complete Guide
Business report format is a standardized structure for organizing findings, analysis, and recommendations. Learn the essential components, layout specs, and formatting best practices—with examples and a pre-submission checklist.
Quick Verdict
A business report format is a standardized structure for presenting findings, analysis, and recommendations in professional documents. Proper formatting ensures consistency, readability, and credibility—making it easier for decision-makers to extract the information they need quickly.
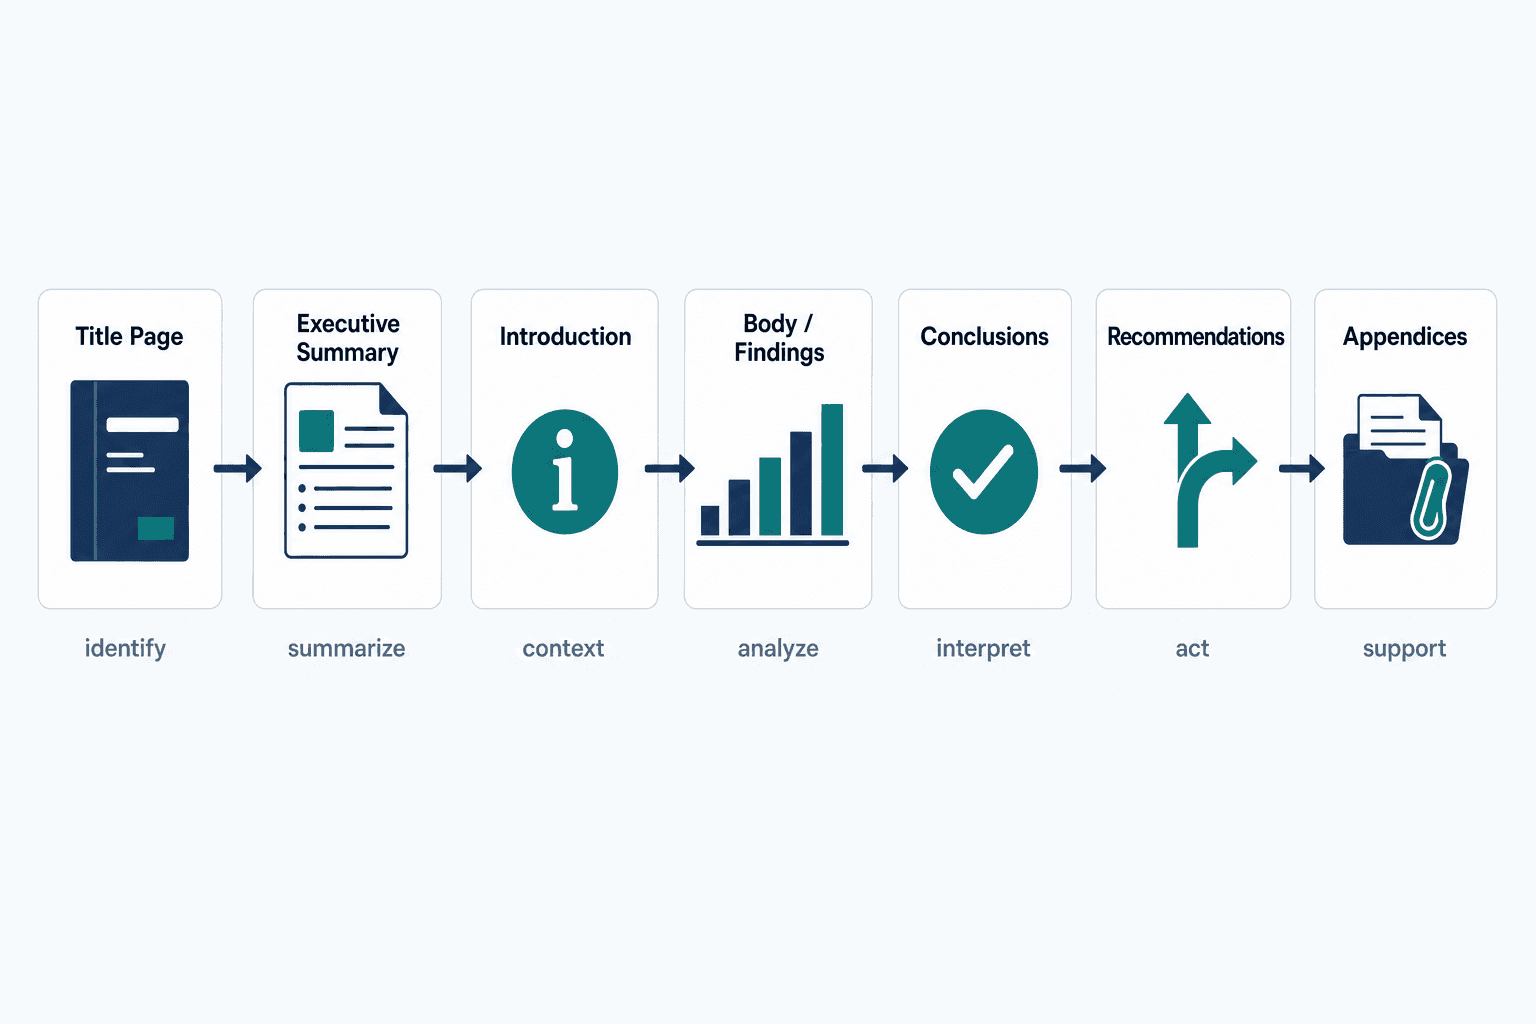
Standard business report format includes a title page, executive summary, introduction, body sections with findings and analysis, conclusions, recommendations, and appendices. Each component serves a specific purpose in guiding readers through your research and supporting informed decisions.
This guide covers everything from basic structure to formatting best practices. You’ll learn the essential components of professional reports, layout specifications, typography guidelines, and how to adapt format for different report types—complete with practical examples and a pre-submission checklist.
What Is Business Report Format?
Business report format is a standardized structure for organizing and presenting business information, data, and recommendations in a professional document. It creates a predictable framework that readers can navigate efficiently.
Organizations use standardized formats because consistency builds credibility and professionalism. When reports follow a familiar structure, readers spend less time figuring out where to find information and more time using it. Standardized formatting also improves document quality across teams—everyone knows what sections to include, how to present data, and where recommendations belong.
Here’s what defines proper business report formatting:
- Clear visual hierarchy — Heading levels, spacing, and typography guide readers through the document structure
- Logical information flow — Sections progress from context to findings to recommendations in an order that supports decision-making
- Professional presentation — Consistent fonts, margins, and styling signal attention to detail and organizational standards
- Integrated data visualization — Charts, tables, and graphs present numbers more effectively than text alone
- Document-wide consistency — One font system, one citation style, one heading format throughout
Essential Components of Business Report Format
Business report format consists of several required sections, each serving a specific purpose in presenting information and supporting conclusions. According to Purdue OWL, report sections should be tailored to reader needs and organized for decision-making use.
Title Page
The title page identifies the report, its authors, and its recipients. It’s the first impression of your document’s professionalism.
Include these required elements:
- Report title — Clear, specific description of the report content and scope
- Author name and department — Who prepared the report and their organizational affiliation
- Recipient name and department — Who commissioned or will receive the report
- Date of submission — When the report was completed or delivered
- Confidentiality notice — If the report contains sensitive or proprietary information
- Company logo — Organizational branding as appropriate
Table of Contents
Include a table of contents when your report exceeds 10 pages or contains multiple sections that readers may need to reference individually. It provides navigation and shows document scope at a glance.
Follow these formatting requirements:
- Page numbers — Accurate page references for every heading and major subsection
- Section headings — Match the exact wording used in the report body
- Subsection indentation — Visual hierarchy showing H2, H3, and H4 relationships
- Automatic generation recommended — Use Word’s built-in TOC feature to ensure accuracy and enable one-click updates when headings change
Executive Summary
The executive summary condenses your entire report into a standalone section that busy decision-makers can read instead of the full document. Purdue OWL notes that this section may be the only part read by executive or managerial audiences making decisions based on your work.
Include these elements:
- Key findings — The most important results and discoveries from your research
- Main conclusions — Your interpretation of what the findings mean
- Primary recommendations — The specific actions you propose based on your analysis
- Methodology overview — Brief explanation of how you conducted the research
- Length guideline — Typically 10% of total report length or one page for shorter reports
Introduction
The introduction provides context and scope for readers unfamiliar with the background or purpose of your work. Purdue OWL recommends explaining the general problem first, then the specific question or task, and finally why the report matters to the reader.
Include these components:
- Background information — Context that explains why this report exists
- Problem statement — The specific business issue or question you’re addressing
- Objectives — What the report aims to accomplish or answer
- Scope and limitations — What’s included, what’s excluded, and any constraints on your analysis
- Methodology overview — How you gathered and analyzed information
- Report structure preview — Brief roadmap of the sections that follow
Body Sections
The body contains your main content organized into logical sections with clear headings. Structure should be tailored to your audience’s experience, needs, and situation rather than following rigid formulas.
Follow these organizational principles:
- Logical progression — Arrange sections in an order that builds understanding step by step
- Clear heading hierarchy — Use H2, H3, H4 levels to show relationships between topics
- One main idea per section — Don’t combine multiple unrelated concepts in the same section
- Evidence-based content — Support claims with data, examples, or citations
- Integrated data visualization — Use charts and tables where numbers tell the story more clearly than text
Findings/Analysis
The findings section presents research results and data analysis objectively. Purdue OWL explains that analysis should explain what results show, note trends, compare results with expectations, and evaluate limitations.
Apply these formatting best practices:
- Subsections for different finding categories — Group related results together with descriptive subheadings
- Charts and graphs for data — Visualize numbers to reveal patterns more effectively than tables alone
- Objective tone — Present findings without inserting opinion or jumping to conclusions
- Citation of sources — Document where data came from and how it was collected
Conclusions
The conclusions section interprets your findings without introducing new information. Purdue OWL defines conclusions as generalizations reasonably deduced from results—distinct from the results themselves.
Keep these key points in mind:
- Summarize main findings — Synthesize the most important results into clear takeaways
- Connect back to objectives — Show how your findings address the questions posed in the introduction
- Avoid new data — Don’t introduce research or evidence that wasn’t covered in the findings section
- Logical flow from findings — Conclusions should feel like a natural next step, not a surprise
Recommendations
The recommendations section proposes actionable next steps based on your findings and conclusions. Purdue OWL describes recommendations as directions or actions that should be taken, or additional work needed to expand the knowledge gained.
Include these elements:
- Specific actions — Clear, implementable steps rather than vague suggestions
- Priority ranking — Help readers understand which recommendations matter most or should be tackled first
- Implementation timeline — Realistic timeframes for execution
- Resource requirements — Budget, personnel, or tools needed to act on recommendations
- Measurable outcomes — How success will be defined or measured for each recommendation
References/Bibliography
Document all sources using a consistent citation style. Proper citations build credibility and allow readers to verify or explore your sources.
Follow these citation guidelines:
- Consistent style — Choose APA, MLA, or Chicago and apply it uniformly
- Alphabetical order — Sort references by author last name or title if no author
- Complete information — Include all required elements (author, date, title, publisher, URL where applicable)
- In-text citation correlation — Every in-text reference should match an entry in the reference list
Appendices
Appendices hold supplementary material that supports your report but would interrupt the flow if included in the main text. Government reports commonly use appendices for detailed data and supporting documentation.
Include these types of appendix content:
- Raw data tables — Complete datasets that findings sections summarize
- Detailed calculations — Step-by-step workings that support numerical conclusions
- Survey instruments — Questionnaires or interview guides used for primary research
- Extended quotations — Full interview transcripts or lengthy source excerpts
- Technical specifications — Detailed methodologies, equipment details, or formulas
Business Report Format Structure and Layout
Physical formatting requirements apply across all report sections and directly affect readability and professionalism. Purdue OWL emphasizes that appropriate typefaces, sizes, styles, and alignments matter as much as content quality.
Page Setup and Margins
Standard page setup creates consistent visual boundaries and ensures reports print or display correctly across different environments.
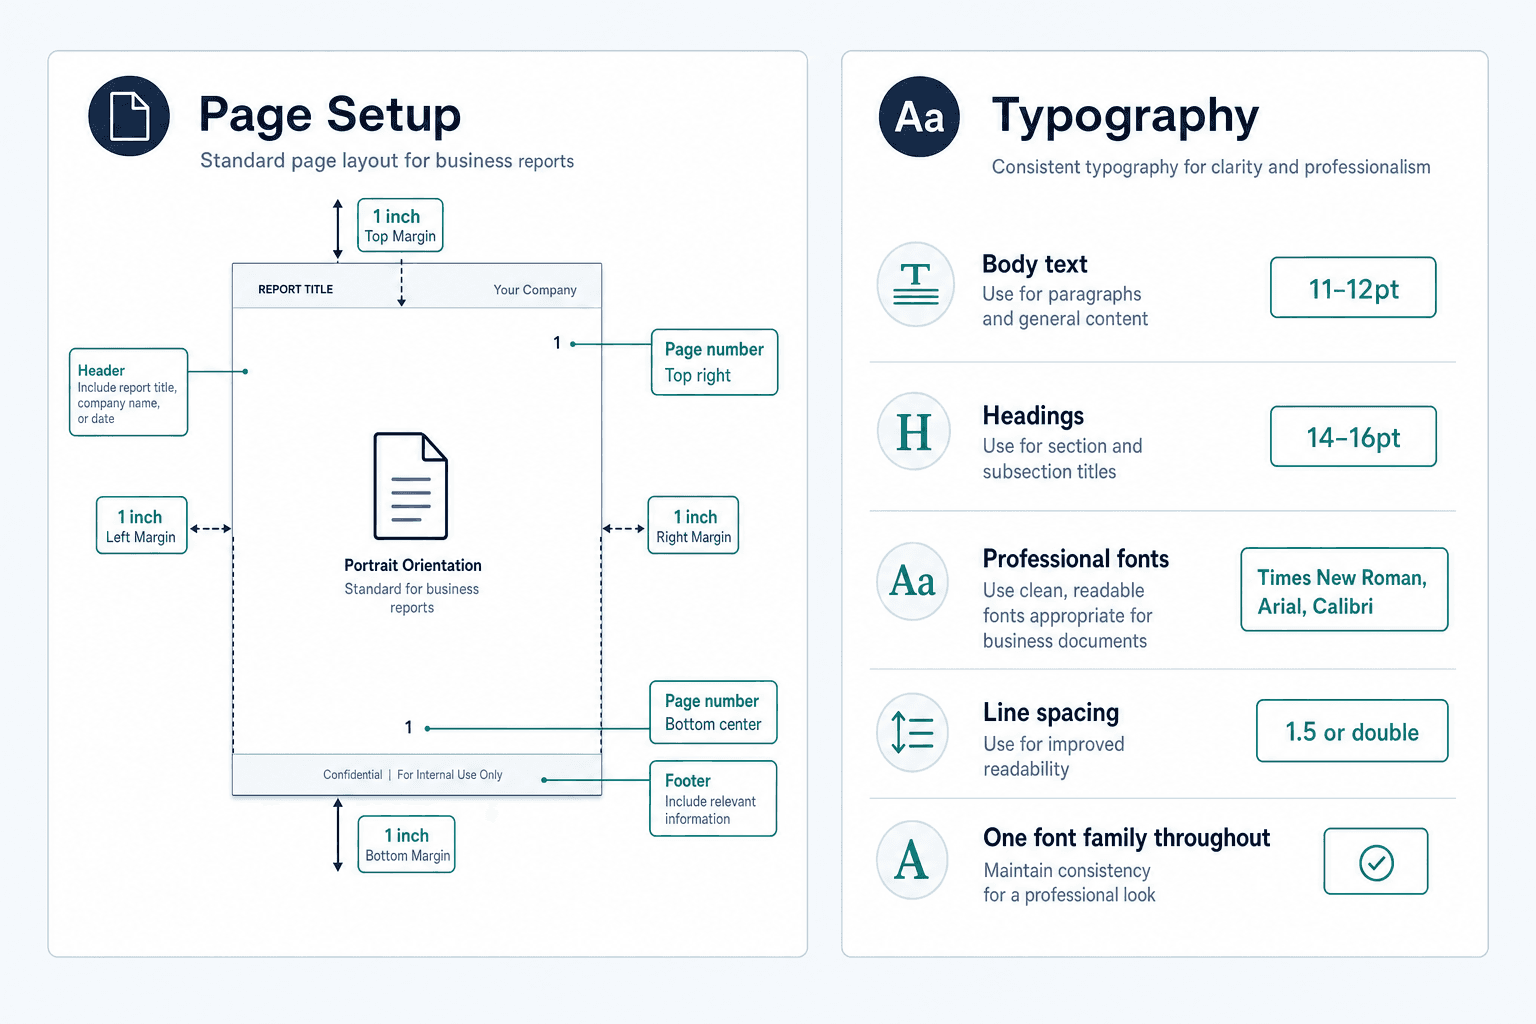
Use these formatting specifications:
- 1-inch margins on all sides — Purdue OWL advises against making margins less than 1 inch
- 8.5" × 11" page size — Standard letter size for North American business documents (A4 in other regions)
- Portrait orientation — Unless charts or wide tables require landscape for specific pages
- Page numbers — Bottom center or top right corner on every page except the title page
- Header/footer guidelines — Include document title, date, or author name as needed for identification
Typography and Font Guidelines
Readable, professional typography choices signal attention to detail and make documents easier to scan. NIST recommends a minimum font size of 12 points when text fits the page.
Apply these font specifications:
- Professional fonts — Times New Roman, Arial, Calibri, or similar business-standard typefaces
- 11-12pt body text — Ensures readability without wasting space
- 14-16pt headings — Clear visual differentiation from body text
- Consistent font throughout — Use one typeface family for the entire document
- Bold for emphasis only — Reserve bold styling for headings and key terms, not entire paragraphs
- No decorative fonts — Script, display, or novelty fonts undermine professional tone
- 1.5 or double line spacing — Improves readability and provides room for printed annotations
Heading Hierarchy
Visual hierarchy makes reports scannable and helps readers navigate to relevant sections quickly. Microsoft Support explains that built-in heading styles enable table-of-contents generation and improve accessibility.
| Level | Purpose | Font Size | Formatting | Example Usage |
|---|---|---|---|---|
| H1 | Report title or main sections | 16-18pt | Bold, possibly all caps | “EXECUTIVE SUMMARY” or “Market Analysis” |
| H2 | Major subsections | 14-16pt | Bold | “Competitive Landscape” or “Customer Segments” |
| H3 | Topic subdivisions | 12-14pt | Bold | “Pricing Strategy” or “Regional Performance” |
| H4 | Detailed breakdowns | 11-12pt | Bold or italic | “Q1 Results” or “Implementation Timeline” |
White Space and Readability
White space—the empty space around text and between sections—makes documents more approachable. NIST plain-language guidance explicitly recommends increasing white space because it makes material look less intimidating.
Follow these white space principles:
- Paragraph spacing — Add 6-12 points of space after each paragraph instead of indenting first lines
- Section breaks — Use extra spacing or page breaks between major sections
- Margin consistency — Maintain even margins throughout; resist the temptation to shrink them to fit content
- Avoid text walls — Break long paragraphs into smaller chunks; aim for 3-5 sentences max
- Balanced page layout — Don’t cram content onto fewer pages at the expense of readability
Formatting Different Types of Business Reports
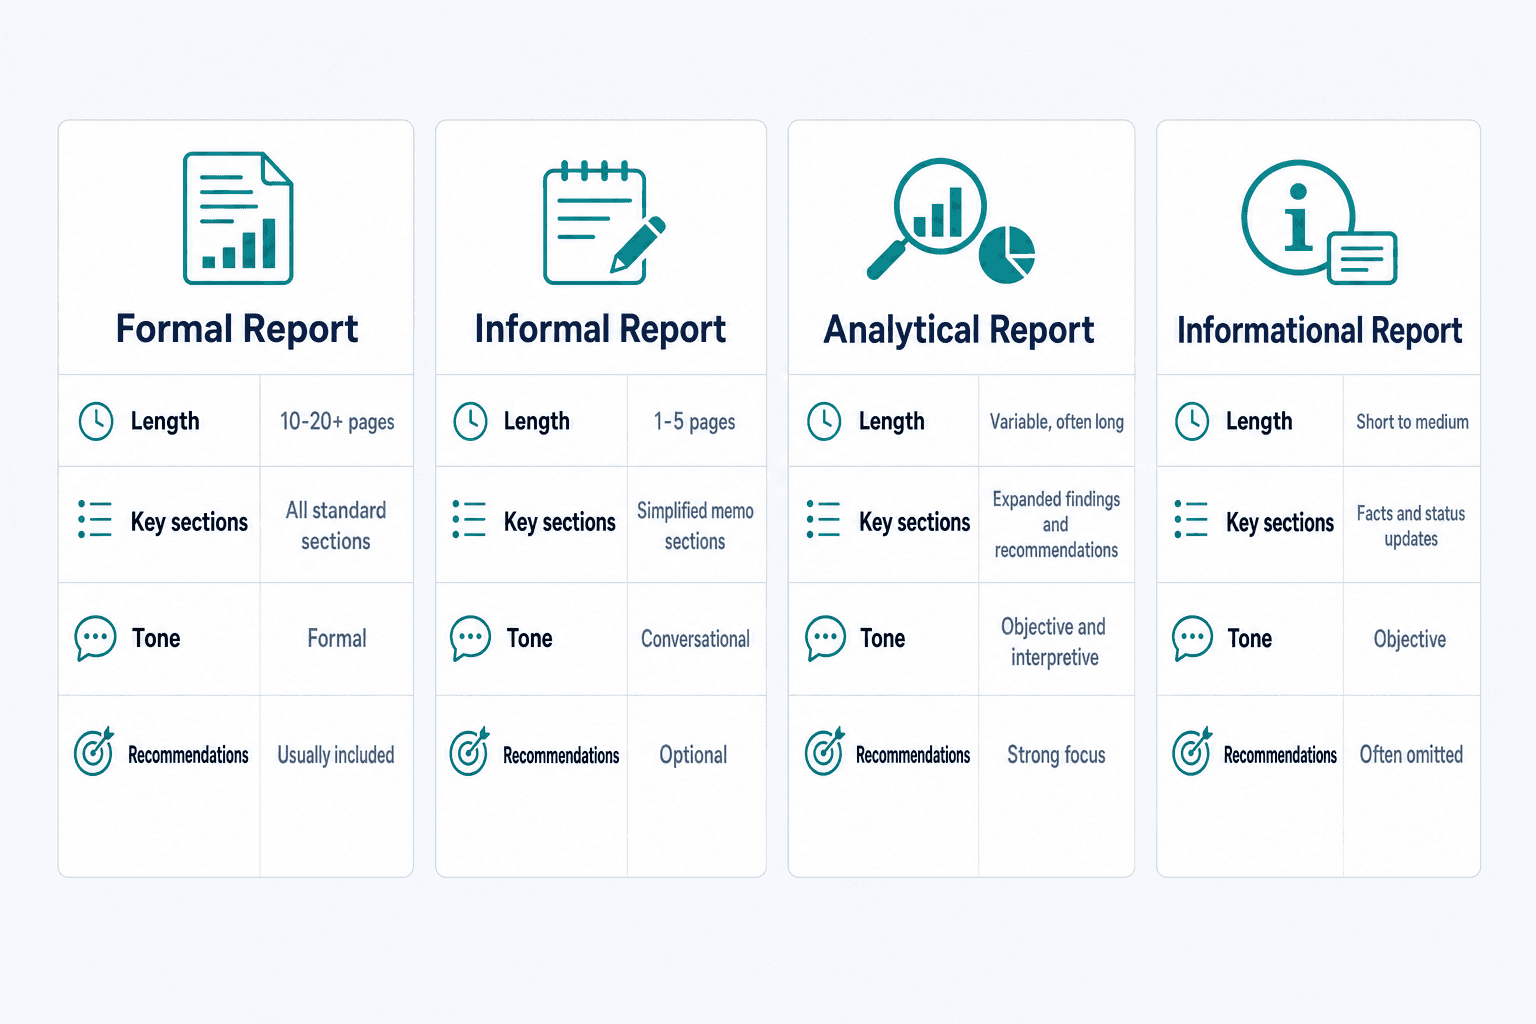
Report format adjusts based on report type and purpose while maintaining core structural principles. Purdue OWL notes that report length and formality vary significantly depending on context and audience.
Formal Business Reports
Formal reports are comprehensive, detailed, and official documents that follow strict formatting standards. Government reports like this one demonstrate the expected structure and tone.
Apply these specific formatting requirements:
- All standard sections included — Title page, TOC, executive summary, introduction, body, conclusions, recommendations, references, and appendices
- Formal tone — Third-person voice, objective language, complete sentences
- Extensive documentation — Full citations for all data sources and references
- Professional binding — Spiral binding, three-ring binders, or formal covers for printed versions
- Strict style compliance — Follow organizational or industry style guides precisely
Informal Business Reports
Informal reports are shorter and more flexible in structure. Purdue OWL explains that activity reports and status updates often take memo or email format rather than full report structure.
You have these formatting flexibilities:
- Memo format acceptable — To/From/Date/Subject header instead of formal title page
- Simplified sections — Skip executive summary and table of contents for reports under 5 pages
- Conversational tone — First-person voice and contractions are fine
- Email delivery common — No need for binding or PDF packaging
- Streamlined appendices — Include only essential supporting materials
Analytical Reports
Analytical reports focus on problem-solving and interpretation. Purdue OWL’s discussion guidance emphasizes analysis of trends, uncertainties, assumptions, and limitations—exactly what analytical reports require.
Emphasize these formatting priorities:
- Extensive findings section — Dedicate more space to data presentation and analysis than conclusions
- Detailed analysis subsections — Break down findings by category, theme, or research question
- Data visualization priority — Use more charts, graphs, and tables than informational reports
- Strong recommendations section — Connect analysis to specific, actionable next steps
Informational Reports
Informational reports present facts without deep analysis or persuasive recommendations. Purdue OWL notes that these reports aim to keep stakeholders informed about tasks and status rather than argue a position.
These formatting characteristics apply:
- Streamlined structure — Focus on clear presentation of facts and updates
- Facts-focused body — Present data objectively without interpretation or opinion
- Minimal conclusions section — Brief summary of what information means, if anything
- Often excludes recommendations — No action items if the goal is purely informational
Visual Elements in Business Report Format
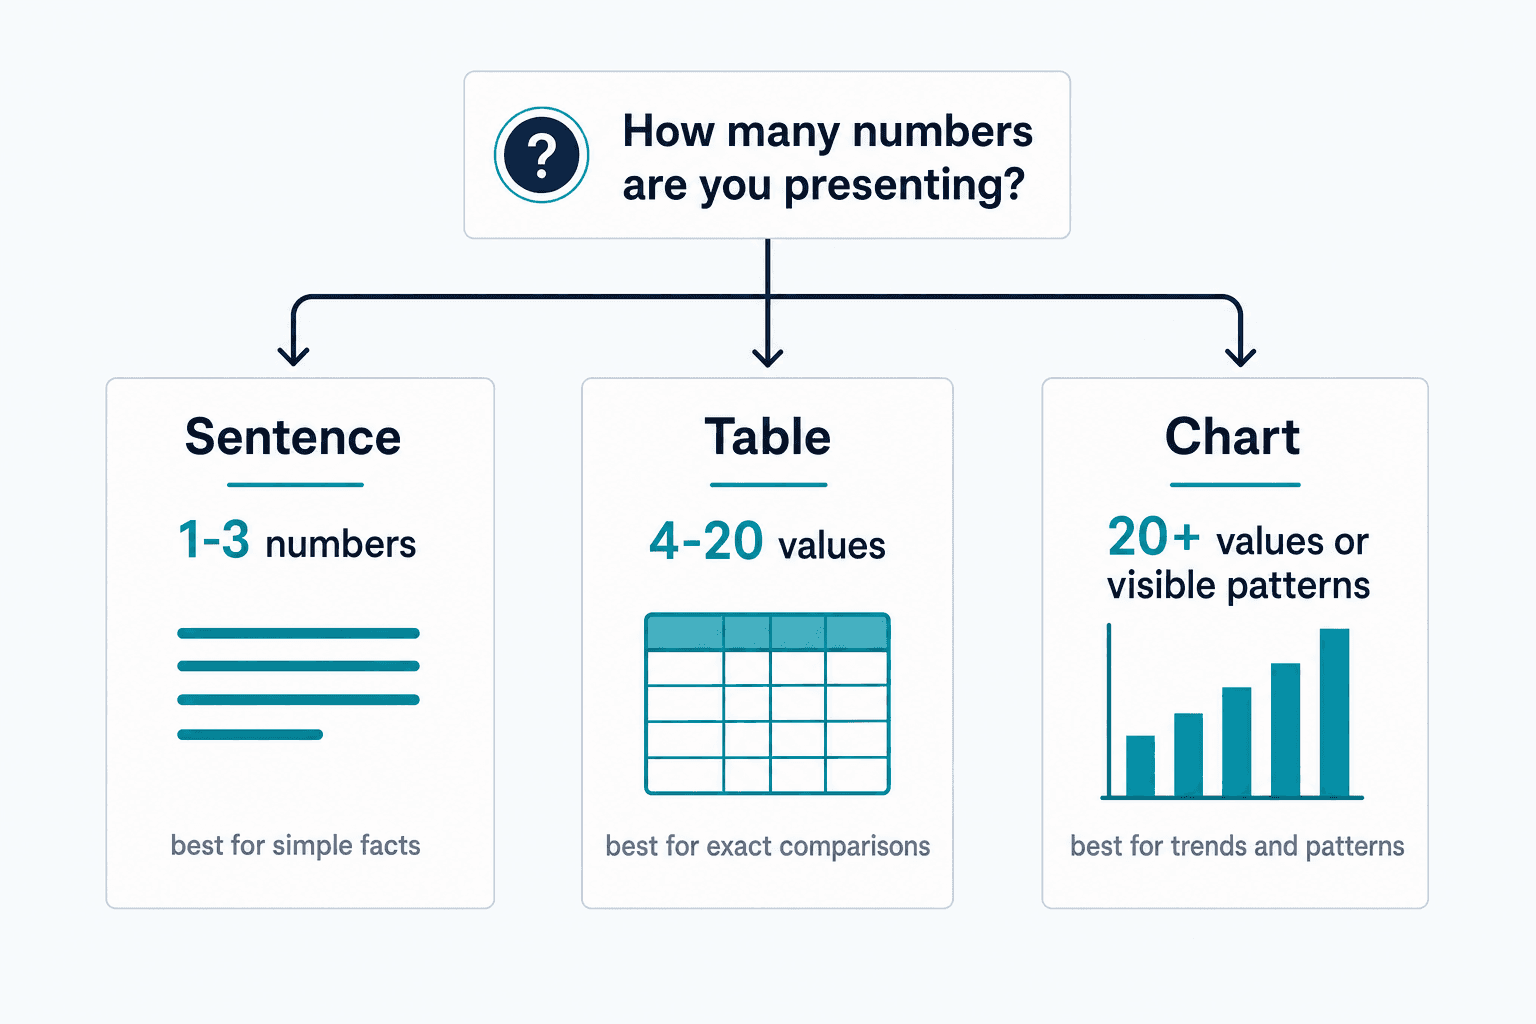
Visual elements help readers understand data and concepts faster than text alone. Purdue OWL recommends choosing among sentence, table, or figure based on how many numbers you’re presenting—fewer than 3 work in text, 4-20 often fit tables, and more than 20 may need charts.
Charts and Graphs
Use data visualizations when patterns, trends, or comparisons are easier to see than to describe. Charts turn numbers into insights.
Follow these best practices:
- Appropriate chart type for data — Bar charts for comparisons, line graphs for trends, pie charts for parts of a whole, scatter plots for correlations
- Clear labels and legends — Every axis, data series, and unit should be labeled; don’t make readers guess
- Referenced in text — Purdue OWL’s report checklist stresses that visuals should be referred to explicitly: “As shown in Figure 3…”
- Positioned near relevant content — Place charts immediately after the paragraph that discusses them
- Professional color scheme — Use high-contrast colors that print clearly in grayscale
- Source citations — Credit data sources directly on or below the chart
Tables
Tables organize structured data into rows and columns for easy comparison. They work best when you need to show exact numbers or multiple data points side by side.
Apply these formatting guidelines:
- Clear column headers — Descriptive labels that explain what each column contains
- Consistent alignment — Numbers align right, text aligns left, headers align with data
- Zebra striping for readability — Alternate row shading improves scanning across wide tables
- Table numbers and captions — “Table 1: Quarterly Revenue by Region” above or below the table
- Fit to page width — Adjust column widths so tables don’t require horizontal scrolling or awkward page breaks
Images and Diagrams
Use illustrative visuals to explain concepts, show processes, or provide concrete examples. IEEE Author Center recommends numbering figures sequentially and citing each in the text.
Follow these requirements:
- High resolution — APA guidelines specify 300 DPI minimum for color images, 600 DPI for line art
- Relevant to content — Every image should have a clear purpose tied to the text
- Numbered figure captions — “Figure 2: Customer Journey Map” below each image
- Cited if not original — Credit the source when using images created by others
- Appropriate sizing — Large enough to see details, small enough to fit on one page without dominating
Business Report Formatting Best Practices
Professional standards elevate report quality and make your work easier for readers to use. These practices apply regardless of report type or industry.
Here’s what consistently works:
- Consistent formatting throughout — Microsoft Support notes that built-in styles ensure navigation and consistency
- Proofread for errors — Typos and grammar mistakes undermine credibility faster than weak content
- Use professional language — Clear, direct writing without jargon or unnecessary complexity
- Cite all sources — Document every statistic, quotation, or borrowed idea
- Number pages — Except the title page, every page should show its position in the document
- Include date on every page — Helps readers track versions and currency of information
- Use templates for consistency — Start with a proven template rather than formatting from scratch
- Maintain objective tone — Present evidence and reasoning without emotional language or bias
- Follow company style guide if available — Internal standards override generic best practices
Common Business Report Format Mistakes to Avoid
Frequent formatting errors undermine professionalism even when content is strong. Watch for these issues before you submit.
Avoid these common mistakes:
- Inconsistent heading styles — Microsoft documentation warns that manually formatted headings break table-of-contents generation
- Missing page numbers — Readers can’t reference specific sections or track their place
- Unprofessional fonts — Comic Sans, script fonts, or decorative typefaces damage credibility
- Dense text blocks — NIST guidance recommends white space to make documents more approachable
- Unlabeled visuals — Charts and tables without captions or numbers confuse readers
- Missing table of contents in long reports — Reports over 10 pages need navigation aids
- Inadequate white space — Cramped layouts feel overwhelming and unprofessional
- Mixing citation styles — Switching between APA, MLA, and informal citations looks sloppy
Business Report Format Checklist
Review these items before submitting your report to catch formatting issues and ensure professional presentation.
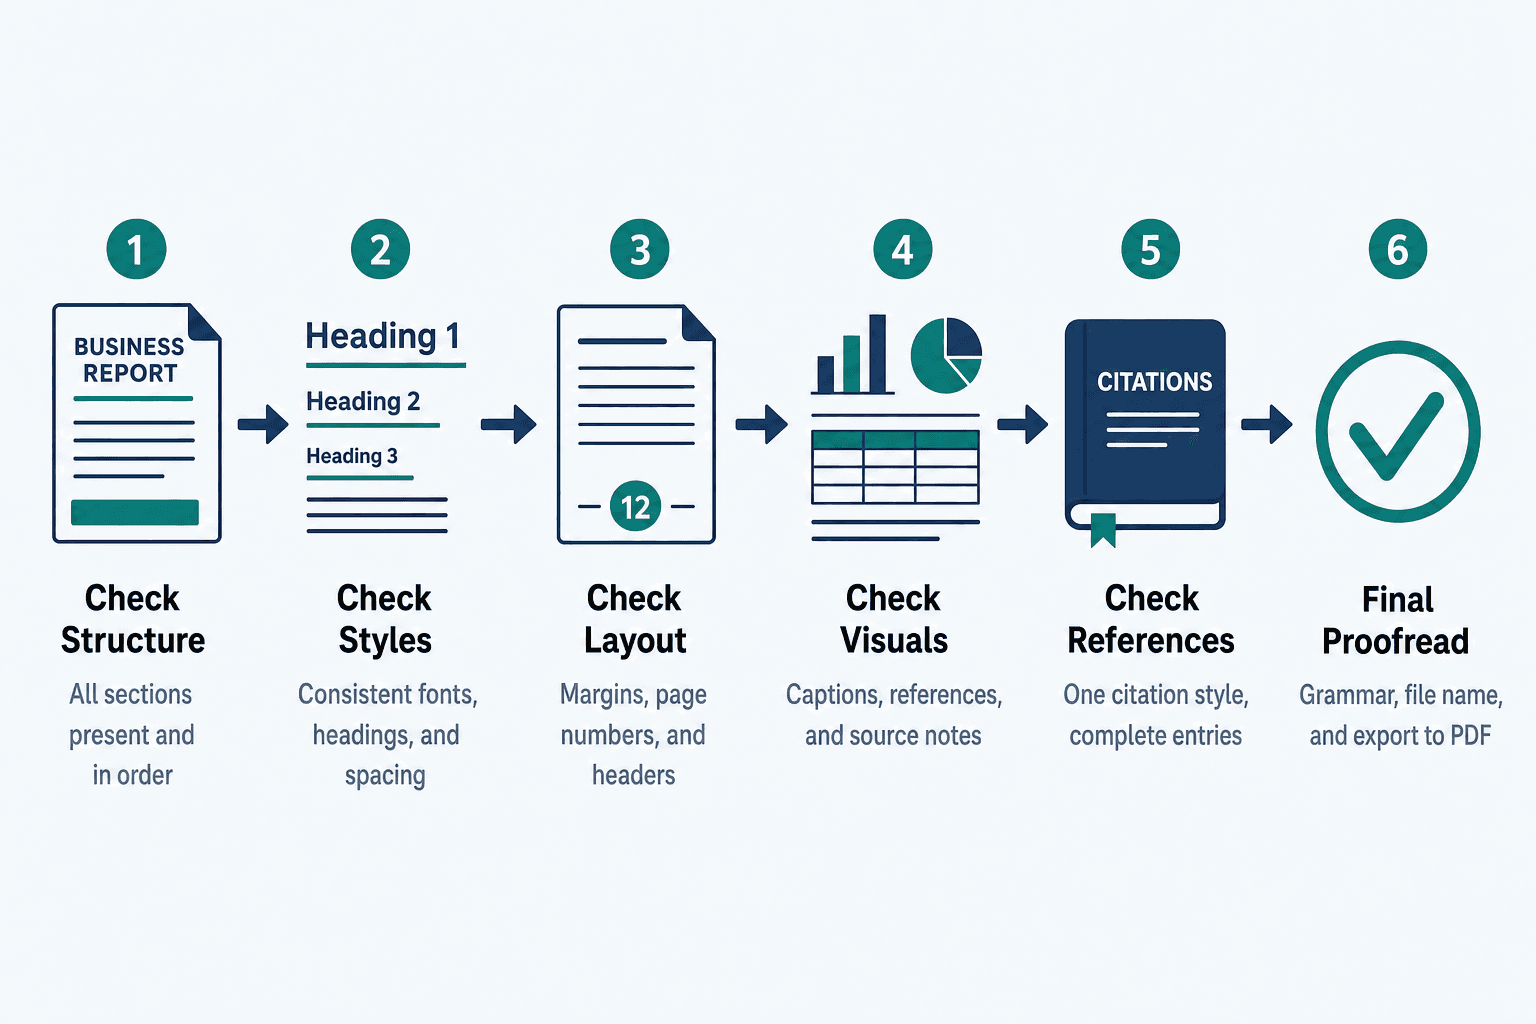
Document Structure:
- [ ] Title page includes report title, author, recipient, date, and confidentiality notice if applicable
- [ ] Table of contents is accurate with correct page numbers
- [ ] Executive summary is included (for reports over 5 pages)
- [ ] All required sections are present and in correct order
- [ ] Appendices are organized and referenced in the main text
Formatting Consistency:
- [ ] Consistent font throughout the entire document
- [ ] Heading hierarchy uses built-in Word styles (H1, H2, H3)
- [ ] Page numbers appear on every page except title page
- [ ] Margins are set to 1 inch on all sides
- [ ] Line spacing is 1.5 or double throughout
Visual Elements:
- [ ] All visuals (charts, tables, images) are properly labeled with numbers and captions
- [ ] Visuals are high resolution and print clearly
- [ ] Every visual is referenced in the text (“as shown in Table 2…”)
- [ ] Data sources are cited on or near each visual
References and Citations:
- [ ] All sources are cited consistently using one style (APA, MLA, or Chicago)
- [ ] In-text citations match reference list entries
- [ ] Reference list is alphabetized
- [ ] URLs are current and functional
Final Review:
- [ ] Document is proofread for spelling and grammar errors
- [ ] File is named descriptively (e.g., “Q4-Sales-Analysis-2025.pdf”)
- [ ] File format is correct (PDF for distribution, Word for collaborative editing)
- [ ] Table of contents is updated to reflect final heading changes
Frequently Asked Questions
What is the standard business report format?
Standard business report format includes a title page, executive summary, introduction, body sections with findings and analysis, conclusions, recommendations, and references. Formal reports also include a table of contents and appendices. Purdue OWL explains that sections should be tailored to reader needs while maintaining this predictable structure.
How do you format a business report?
Start by selecting a template or setting up your page layout with 1-inch margins and professional fonts. Create your title page, then organize content into standard sections—executive summary, introduction, body, conclusions, recommendations, references. Apply consistent heading styles using built-in formatting tools. Add visuals where data needs clarification, and proofread carefully before submission. Microsoft Support recommends built-in heading styles for consistency and navigation.
What are the main parts of a business report format?
The main parts are title page (identifies the document and parties involved), executive summary (condensed version for decision-makers), introduction (provides context and objectives), body sections (present findings and analysis), conclusions (interpret results), recommendations (propose next steps), and references (document sources). Longer reports add a table of contents after the title page and appendices at the end for supplementary material.
How long should a business report be?
Report length varies based on scope and purpose. Informal status updates may be 1-2 pages, while comprehensive analytical reports typically run 10-20 pages. Purdue OWL notes that executive summaries should be roughly 10% of total report length. Write as much as needed to cover your topic thoroughly—no more, no less.
What font should I use for a business report?
Use professional, readable fonts like Times New Roman, Arial, or Calibri. Set body text to 11-12 points and headings to 14-16 points. NIST recommends a minimum of 12 points for body text to ensure readability. Stick with one font family throughout the entire document for consistency and professional appearance.
Do business reports need an executive summary?
Yes, for most formal business reports over 5 pages. Purdue OWL stresses that executive summaries may be the only section read by managerial audiences making decisions. Short informal reports under 5 pages can skip the executive summary if the entire report is brief enough to read quickly. When in doubt, include one—it never hurts.