Business Report Structure: Key Components
Business reports need standard components—executive summary, methodology, findings, recommendations—to turn data into decisions. This guide explains each section with examples so your reports actually get read and acted on.
Quick Verdict
A business report structure is built from essential components that organize information logically—executive summary, methodology, findings, recommendations, and supporting sections. Each component serves a distinct purpose and follows a standardized format that guides readers through complex business information.
Proper structure matters because it turns raw data into actionable intelligence. When a CFO needs to decide on a $2M investment, they scan the executive summary first. When an analyst needs to verify your methodology, they jump straight to that section. Without clear structure, even brilliant insights get lost in the shuffle.
This guide breaks down each component with examples and practical advice so you can create reports that actually get read—and acted on.
What Are Business Report Structure Components?
Business report structure components are standardized sections that organize information logically from executive summary through appendices. They create a predictable framework that helps both writers organize complex findings and readers locate specific information quickly.
These components aren’t rigid formulas—they’re adaptable templates. The exact structure depends on your audience, context, and the story your report needs to tell. A technical report for engineers will emphasize methodology differently than a business case for executives, but both use the same foundational components.
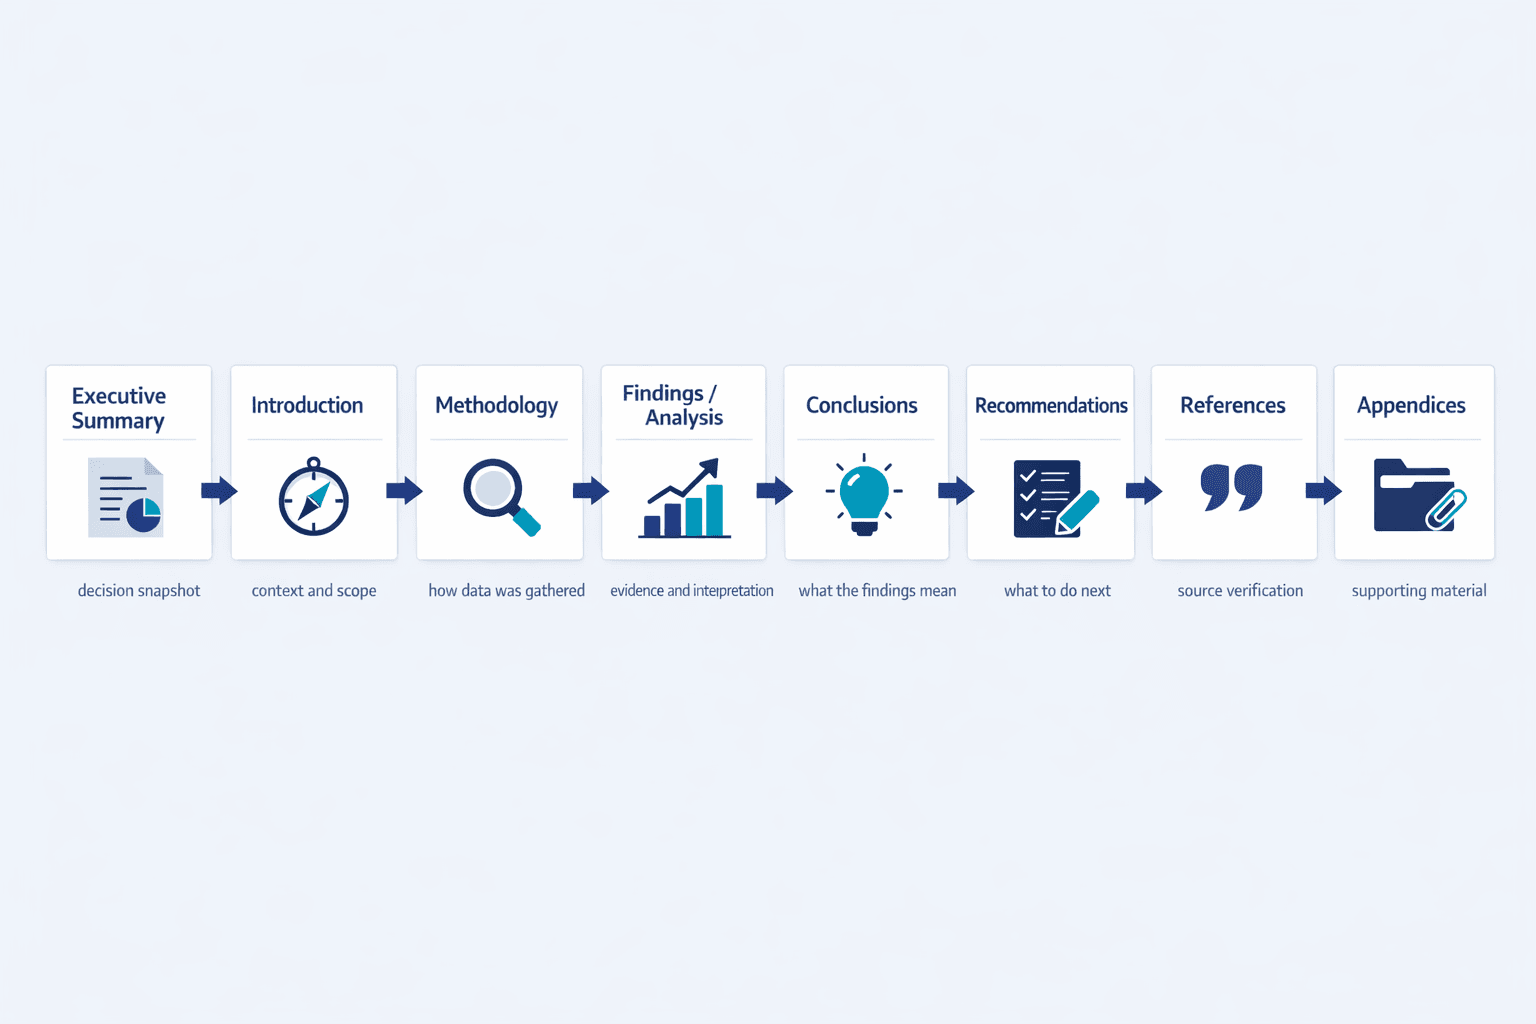
Core components include:
- Executive Summary — Distills key findings and recommendations for decision-makers who may not read the full report
- Introduction — Establishes context, defines scope, and states the report’s purpose
- Methodology — Documents how data was collected and analyzed to build credibility
- Findings/Analysis — Presents data and observations with interpretation
- Conclusions — Synthesizes findings into meaningful insights without introducing new information
- Recommendations — Proposes specific, actionable steps based on conclusions
- References — Documents external sources for verification and credibility
- Appendices — Houses supplementary material that would clutter main sections
Why Standard Structure Matters
Standardized components ensure consistency across organizations and make reports easier to navigate. When everyone in your company knows that executive summaries always come first and methodology always precedes findings, readers can jump straight to what matters to them.
Benefits of using standard structure:
- Professional credibility — Consistent formatting and clear headings signal that you’re thorough and organized
- Time efficiency for readers — Decision-makers can scan headings and find relevant sections in seconds
- Better decision-making — Logical flow from findings to conclusions to recommendations makes the case for action clearer
- Easier archiving and reference — Future teams can quickly locate specific data or methodology details
- Reduced cognitive load — Predictable structure lets readers focus on content instead of figuring out where information lives
Executive Summary Component
The executive summary distills your key findings and recommendations into 1-2 pages for busy stakeholders who need to make decisions fast. It’s the first thing readers see, even though it’s typically the last thing you write.
This section exists because executives and managers often only read the summary. If they have 30 seconds between meetings to decide whether to allocate budget based on your report, this is all they’ll see. Make it count.
What to Include in an Executive Summary
Your executive summary should present the essence of the report, not just list what’s inside. Think synthesis, not table of contents.
Essential elements:
- Report purpose — Why this report exists and what question it answers
- Key findings — The 3-5 most important discoveries from your research
- Primary data points — Specific numbers that support your findings
- Main conclusions — What those findings mean for the business
- Critical recommendations — The actions you’re proposing
- Next steps — Who needs to do what by when
Keep it to roughly 10% of your full report length. Avoid jargon and technical terms—if a finance executive needs to understand your technical findings, translate them into business impact. Don’t build suspense or save your conclusions for later. Put the most important information first.
Introduction and Background Component
The introduction establishes context, defines scope, and states your report’s purpose and objectives upfront. It’s the section that tells readers why this report exists and what boundaries you’ve set around your research.
Think of it as orienting new hikers before a trail. They need to know where they’re starting, where they’re going, and what terrain to expect. That’s what your introduction does for readers who need full context before diving into data.
Essential Introduction Elements
A strong introduction gives readers the roadmap they need without overwhelming them with detail.
Include these elements:
- Problem statement or research question — What specific issue or question prompted this report
- Report objectives — What you set out to accomplish
- Scope and limitations — What’s included, what’s excluded, and why
- Background information — Relevant context readers need to understand your findings
- Stakeholders involved — Who commissioned the report and who will act on it
- Report structure overview — A brief roadmap of what’s coming in each section
Adjust your introduction depth based on audience familiarity. If you’re reporting to the team that commissioned the research, you can skip extensive background. If you’re presenting to new stakeholders, spend more time on context.
Methodology Component
The methodology documents how you collected, analyzed, and interpreted your data. It shows exactly how the investigation was conducted so others can verify or replicate your work.
Methodology transparency builds credibility. When you explain your approach clearly, readers can judge whether your conclusions are sound. Analytic results should be capable of being substantially reproduced through independent analysis using identical methods—that’s only possible if you document those methods.
Key Methodology Details
Strong methodology sections include enough detail that a knowledgeable reader could replicate your approach.
Document these elements:
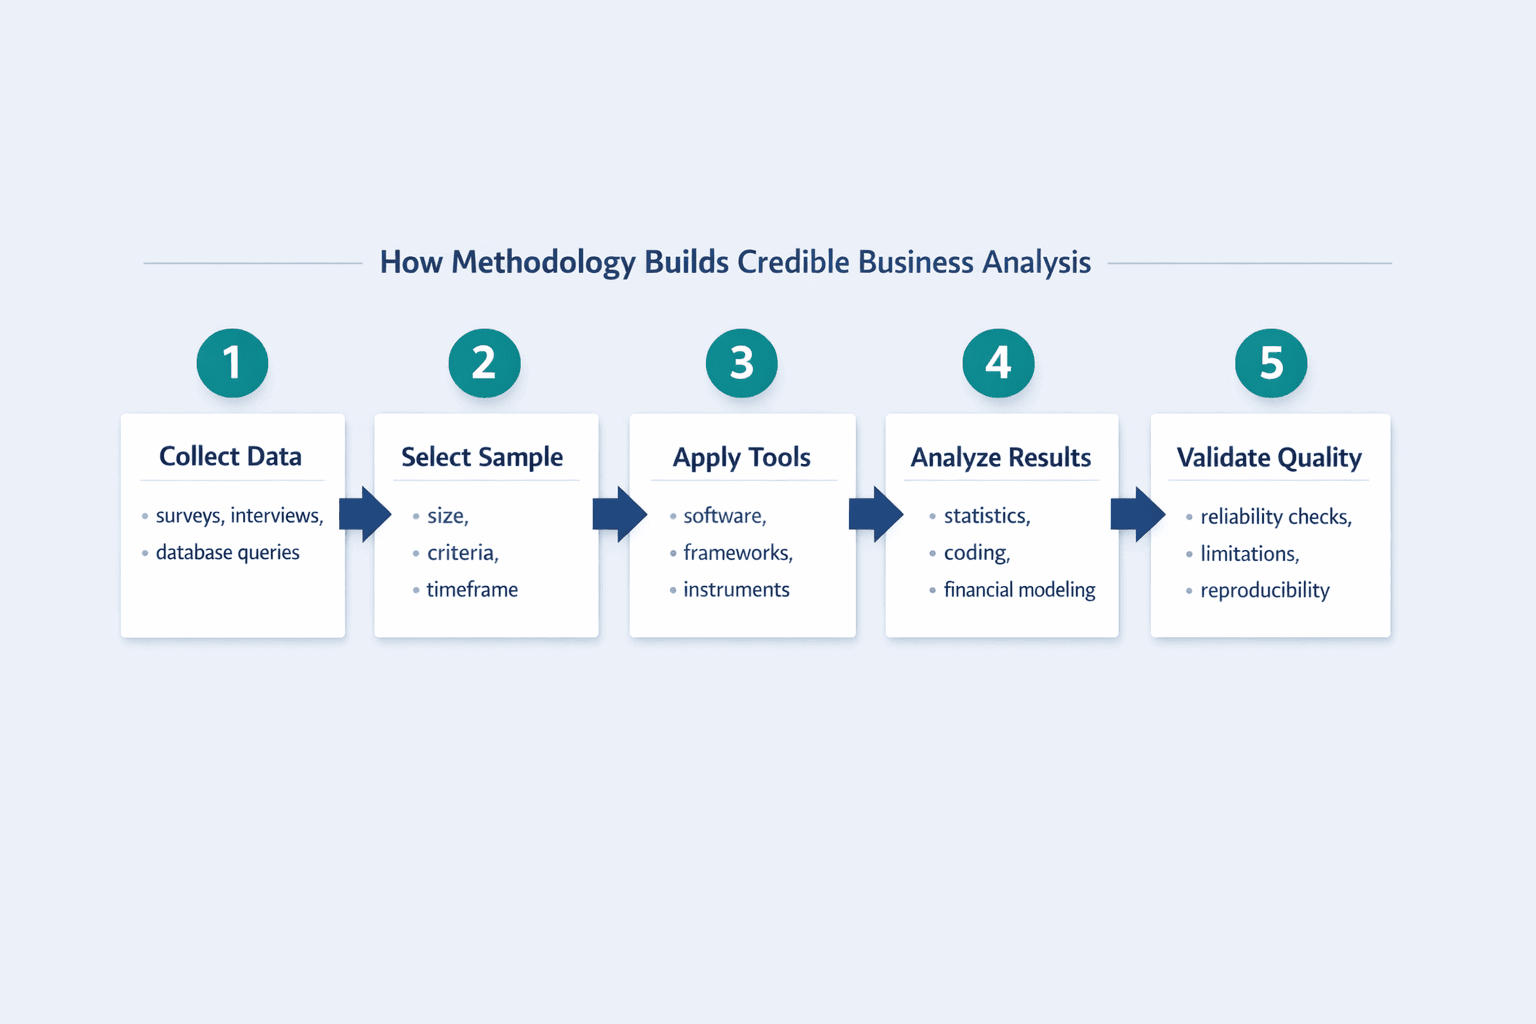
- Data collection methods — Surveys, interviews, database queries, experiments
- Sample size and selection criteria — How many subjects, how they were chosen
- Research tools used — Software, frameworks, or instruments
- Analysis techniques — Statistical methods, qualitative coding, financial modeling
- Timeframe — When data was collected and analyzed
- Limitations of approach — What your methodology couldn’t capture
- Validation methods — How you checked data quality and reliability
Adjust technical detail based on audience expertise. Financial analysts need to understand your DCF assumptions. C-suite executives need the methodology summarized in plain language.
Findings and Analysis Component
Findings and analysis present your data, observations, and interpretation without jumping ahead to recommendations. This section distinguishes what you found from what you think about it—though good analysis integrates both.
This is typically the longest section in your report. It’s where you show your work—the evidence that supports everything that comes after.
Structuring Findings Effectively
How you organize findings determines whether readers can follow your logic or get lost in data.
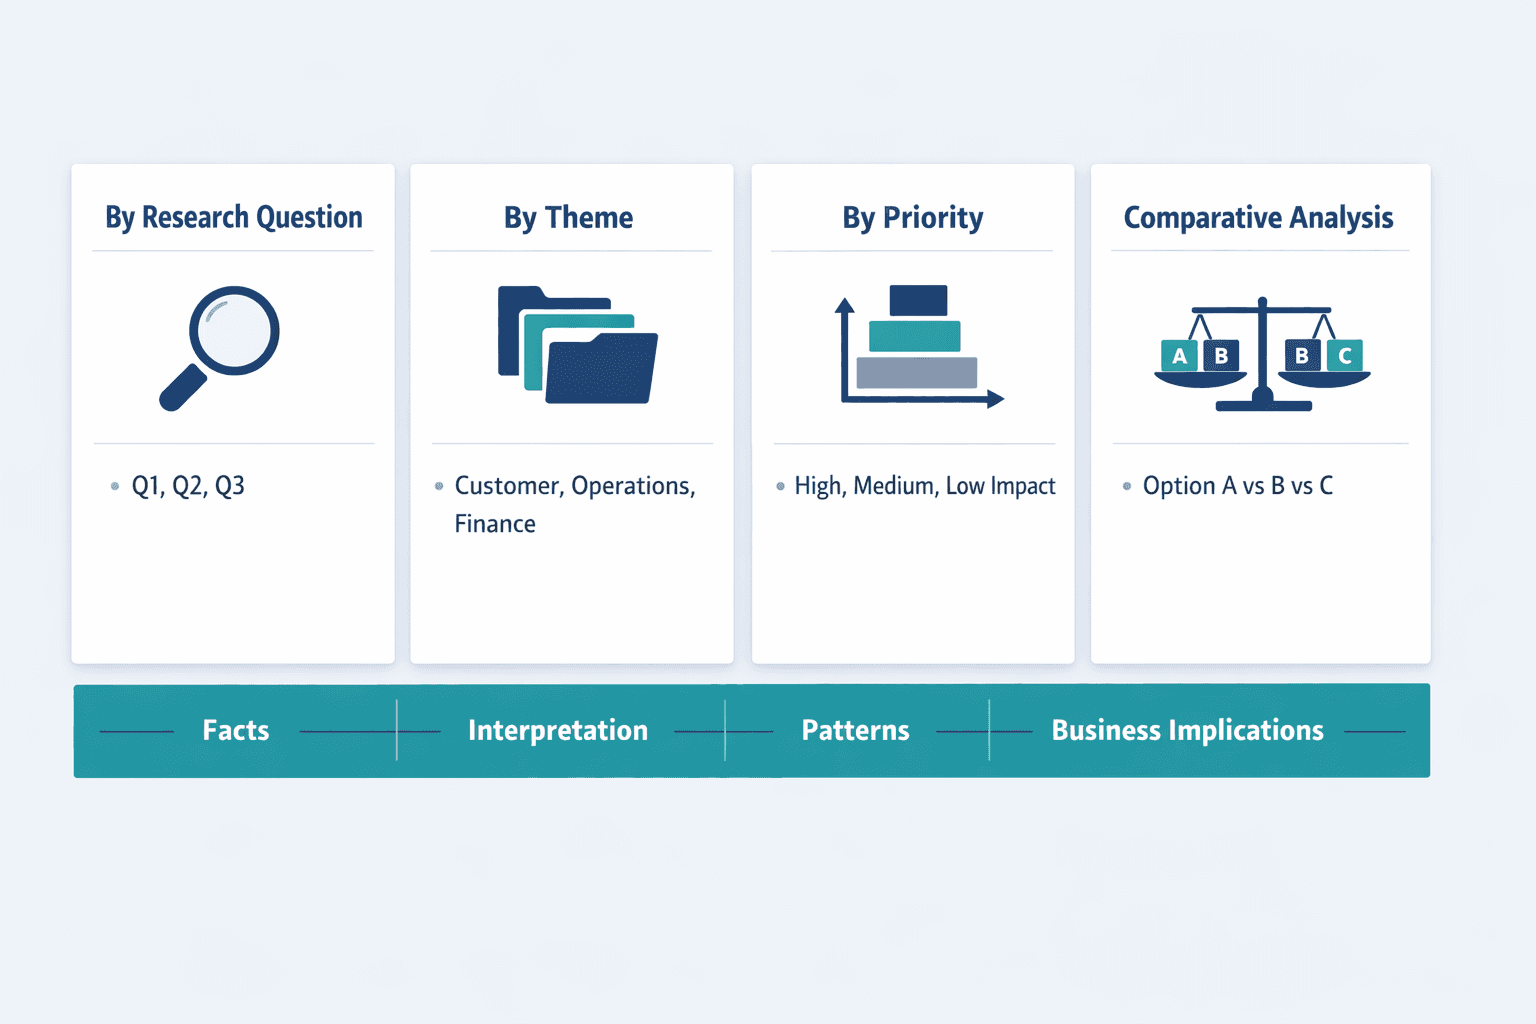
Consider these organizational approaches:
- By research question — Each question gets its own subsection with relevant findings
- By theme/category — Group related findings together (customer feedback, operational data, financial metrics)
- By priority — Start with the most significant findings, then move to supporting details
- Chronologically — Useful for process analysis or timeline-dependent findings
- By department/division — When comparing performance across business units
- Comparative analysis — Side-by-side comparison of options, scenarios, or time periods
Use visual elements strategically. Charts, graphs, and tables make complex data easier to understand—research shows tables and bar graphs achieve the highest comprehension scores for numeric data.
Analysis Best Practices
Analysis turns raw findings into insights by connecting patterns to business implications.
Follow these guidelines:
- Separate facts from interpretation — Make it clear when you’re presenting data versus drawing conclusions from it
- Support claims with data — Every interpretation should point back to specific findings
- Identify patterns and trends — Don’t just list observations—explain what they mean together
- Acknowledge conflicting data — Address outliers or contradictions rather than ignoring them
- Connect findings to objectives — Show how each finding relates back to your report’s purpose
Conclusions Component
Conclusions synthesize your findings into meaningful insights without introducing new information. They’re logical inferences based on your findings, not mechanical summaries of what you already said.
This section bridges the gap between “here’s what we found” and “here’s what we should do about it.” Strong conclusions set up recommendations by making the case that action is necessary.
What Makes Strong Conclusions
Effective conclusions flow naturally from the evidence you’ve presented.
Key characteristics:
- Directly tied to report objectives — Answer the questions you set out to answer
- Supported by findings — Every conclusion should trace back to specific data
- Acknowledge limitations — Note where evidence is weak or where questions remain
- Avoid personal opinions — Stick to what your evidence supports
- Prioritize most significant insights — Lead with what matters most
- Answer the original research questions — Close the loop you opened in your introduction
Recommendations Component
Recommendations propose specific actions based on your conclusions. They should state clearly what actions need to be taken and who should take them.
This is often what decision-makers turn to first—even before the executive summary. Make your recommendations actionable enough that someone could start implementing them immediately.
Crafting Actionable Recommendations
Include these elements:
- Specific actions — “Implement weekly sprint retrospectives” not “improve team communication”
- Responsible parties — Who owns each recommendation
- Timelines — When implementation should begin and complete
- Required resources — Budget, personnel, tools needed
- Priority ranking — Which recommendations are critical versus nice-to-have
- Expected outcomes — Measurable results you anticipate
- Implementation considerations — Potential obstacles and how to address them
| Weak Example | Strong Example | Why It Works |
|---|---|---|
| “Consider improving customer service” | “Train support team on new CRM system by Q2, led by Customer Success Director with $15K budget” | Specifies action, owner, deadline, and resources |
| “Review pricing structure” | “Reduce Pro plan price to $24.99/month effective July 1 to match competitor rates and maintain 40% margin” | Quantifies change, sets date, ties to business goal |
| “Enhance security measures” | “Implement two-factor authentication for all user accounts by September 30, preventing an estimated 89% of account takeover attempts based on industry data” | Concrete action, deadline, measurable outcome |
References and Citations Component
References document all external sources you used, lending credibility and allowing readers to verify your claims. Following a consistent citation style—APA, MLA, or Chicago—matters for professional consistency.
When you cite sources properly, you show you’ve done your homework. When you skip citations or cite inconsistently, readers question whether your other work is equally sloppy.
What to Include in References
Not everything needs formal citation, but these do:
- Published research — Journal articles, books, white papers
- Internal documents — Previous reports, policy manuals (when referencing specific claims)
- Interviews conducted — Published interviews cited by medium; personal communications cited in-text only
- Data sources — Databases, datasets, APIs
- Industry reports — Gartner, Forrester, trade association publications
- Regulatory documents — Laws, standards, compliance requirements
Appendices Component
Appendices hold supplementary material that supports your report without cluttering the main narrative. This supplementary information comes after recommendations and includes detailed data or technical specs.
Use appendices when you need to show extensive supporting evidence but including it in the body would disrupt your flow. Readers who want to dig deeper can find everything they need in the back.
Common Appendix Contents
Include these types of material:
- Raw data tables — Full datasets that findings sections summarized
- Questionnaires/surveys — Complete survey instruments used
- Detailed calculations — Extended formulas or financial models
- Technical specifications — Product specs, system requirements
- Additional charts/graphs — Visualizations that didn’t fit in findings
- Glossary of terms — Definitions for specialized vocabulary
- Interview transcripts — Full text of key interviews (when appropriate)
- Supporting documents — Contracts, policies, or other reference material
Formatting and Presentation Components
Structural formatting elements make reports professional and navigable—title pages, table of contents, headers, footers, and page numbers aren’t optional extras. These mechanical elements help readers find specific sections quickly.
Proper formatting shows respect for your readers’ time. When someone needs to reference page 47 six months from now, they’ll appreciate that you numbered your pages and included a table of contents.
Standard Formatting Elements
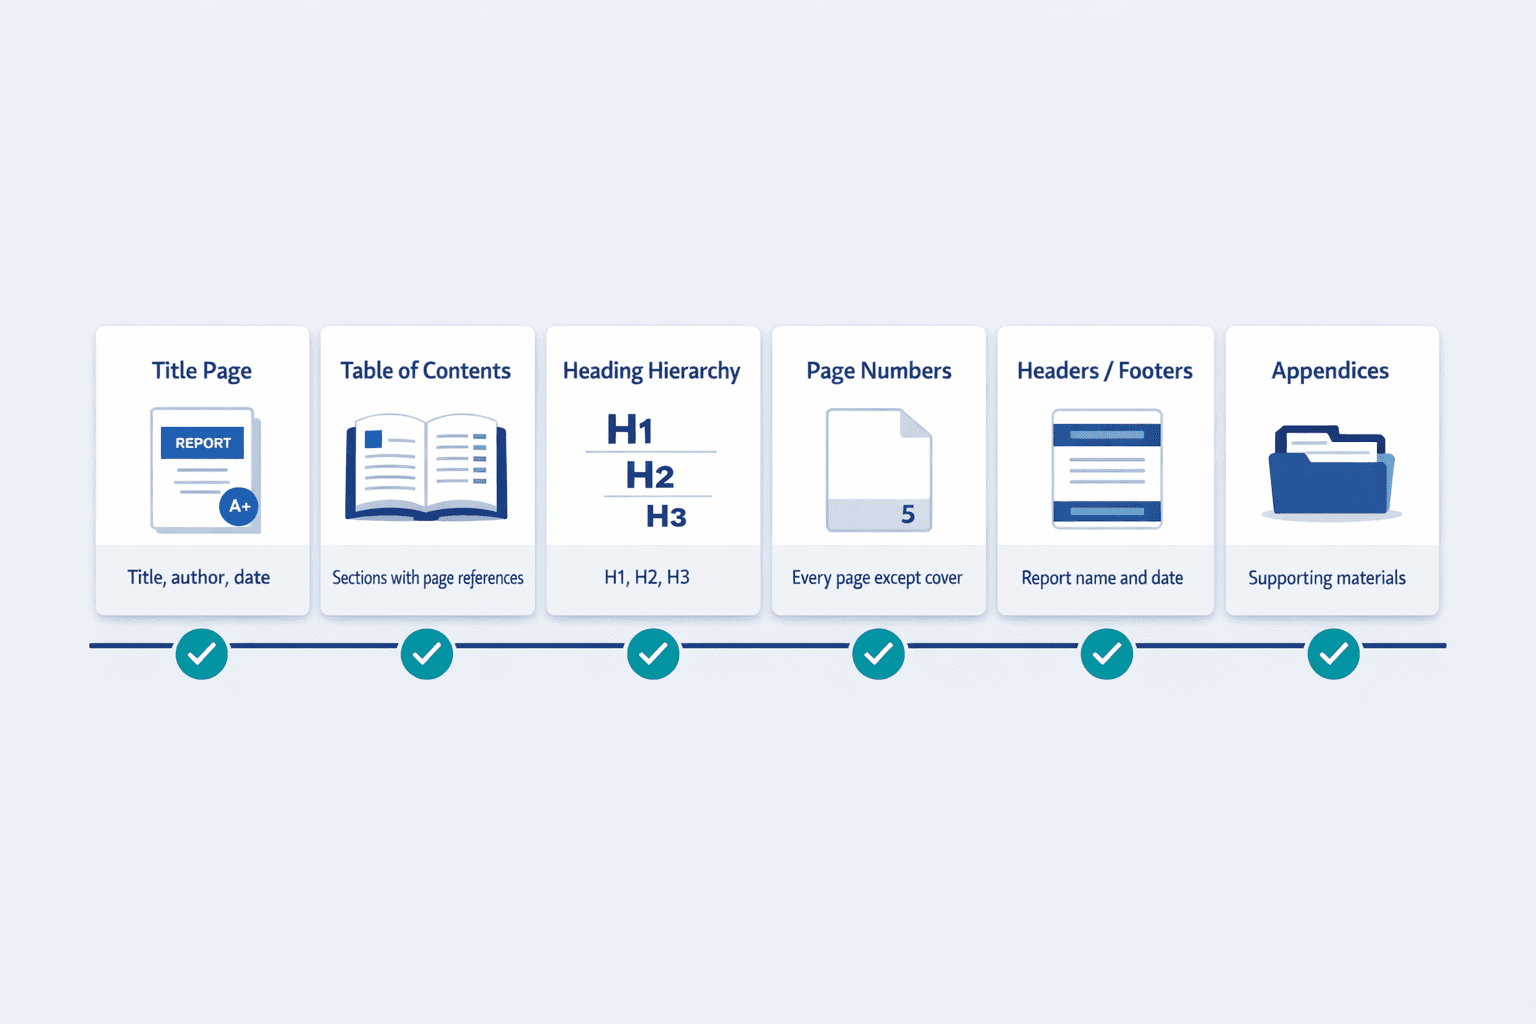
Professional reports include:
- Title page — Report title, author, date, organization, confidentiality notice if needed
- Table of contents — Lists all headings and subheadings exactly as they appear with page numbers
- Consistent heading hierarchy — H1 for main sections, H2 for subsections, H3 for details
- Page numbers — On every page except the title page
- Headers/footers — Include report name, date, and page numbers for easy reference
- Section dividers — Visual breaks between major components
- White space for readability — Margins, line spacing, paragraph breaks
- Professional font and sizing — 11-12pt serif for body text, sans-serif for headings
Adapting Components by Report Type
Not all reports require every component. The content and structure vary according to purpose, aims, and audience—informal reports may combine sections while formal reports include all elements.
Component Variations by Report Type
| Component | Informal Report | Formal Report | Technical Report |
|---|---|---|---|
| Executive Summary | Optional | Required | Required |
| Title Page | Optional | Required | Required |
| Table of Contents | Omit | Required | Required |
| Introduction | Brief (combined with background) | Separate section | Detailed with scope |
| Methodology | Brief or omit | Required | Detailed with validation |
| Findings | Combined with analysis | Separate from analysis | Extensive with data |
| Conclusions | Combined with recommendations | Separate section | Separate section |
| Recommendations | Required | Required | Optional (depends on purpose) |
| References | As needed | Required | Required |
| Appendices | Rare | As needed | Extensive |
Consult organizational templates or style guides before adapting structure. Most companies have report standards that override general best practices.
Common Mistakes to Avoid
Structural mistakes undermine report effectiveness even when your analysis is solid. Business writing requires substantial revision to ensure organization matches reader needs.
Watch out for these errors:
- Mixing findings with recommendations — Keep them separate so readers can evaluate evidence before considering actions
- Burying key information — Put the most important information first, not deep in section 4
- Inconsistent section depth — When methodology gets 8 pages but critical findings get half a page, priorities are backwards
- Missing methodology details — If readers can’t verify your approach, they’ll question your conclusions
- Unsupported conclusions — Every conclusion needs clear ties to specific findings
- Skipping executive summary — Decision-makers often read nothing else
- Poor logical flow between sections — Each section should naturally lead to the next
- Neglecting visual hierarchy — When everything looks equally important, nothing stands out
Getting Started with Your Report Structure
Start with an outline that maps to standard components before you write a single sentence. Define your objectives and audience first, then build your structure around what they need to know.
Follow these steps:
- Define objectives and audience: What decisions will this report inform? Who needs to make those decisions?
- Select relevant components: Based on report type and organizational standards, determine which components you need.
- Create section outline with key points: List the 3-5 main points for each section before writing full paragraphs.
- Gather supporting materials: Collect data, citations, and visuals before drafting so you’re not hunting for sources mid-write.
- Draft in component order: Write introduction and methodology early to clarify scope. Write executive summary last.
Use organizational templates when available—they’ll save hours of formatting work and ensure compliance with company standards. Customize structure based on your specific report purpose, but keep the standard framework intact. Readers expect conclusions before recommendations and findings before conclusions. Don’t get creative with the order.