Daily, Weekly and Monthly KPI Reports Explained
Daily reports monitor fast-moving metrics, weekly reports reveal short-term patterns, and monthly reports assess strategic performance. Learn which metrics belong in each report type and when to use them.
Quick Verdict
KPI reports track business performance over specific periods—daily for operational metrics, weekly for tactical reviews, and monthly for strategic analysis. Each cadence serves a distinct purpose: daily reports monitor fast-moving metrics that need immediate attention, weekly reports reveal short-term patterns, and monthly reports provide comprehensive business health assessments.
Reporting frequency matters because different audiences need different views. Frontline managers use daily reports to spot operational issues, department heads rely on weekly reports for team performance reviews, and executives depend on monthly reports for strategic decision-making. The right cadence ensures decision-makers get relevant information at the right time without drowning in data.
This guide covers what each report type contains, when to use each frequency, and how templates standardize reporting while saving time. You’ll learn which metrics belong in each report type, how to structure templates for daily through monthly reporting, and how to choose the right cadence for your metrics and audience.
What Is a Daily KPI Report?
A daily KPI report tracks operational metrics that change frequently and require immediate attention. It’s the pulse-check that tells frontline managers whether today is going according to plan.
Key characteristics of daily KPI reports:
- Focus on operational metrics that can actually change within 24 hours
- Use real-time or near-real-time data (updated hourly or multiple times per day)
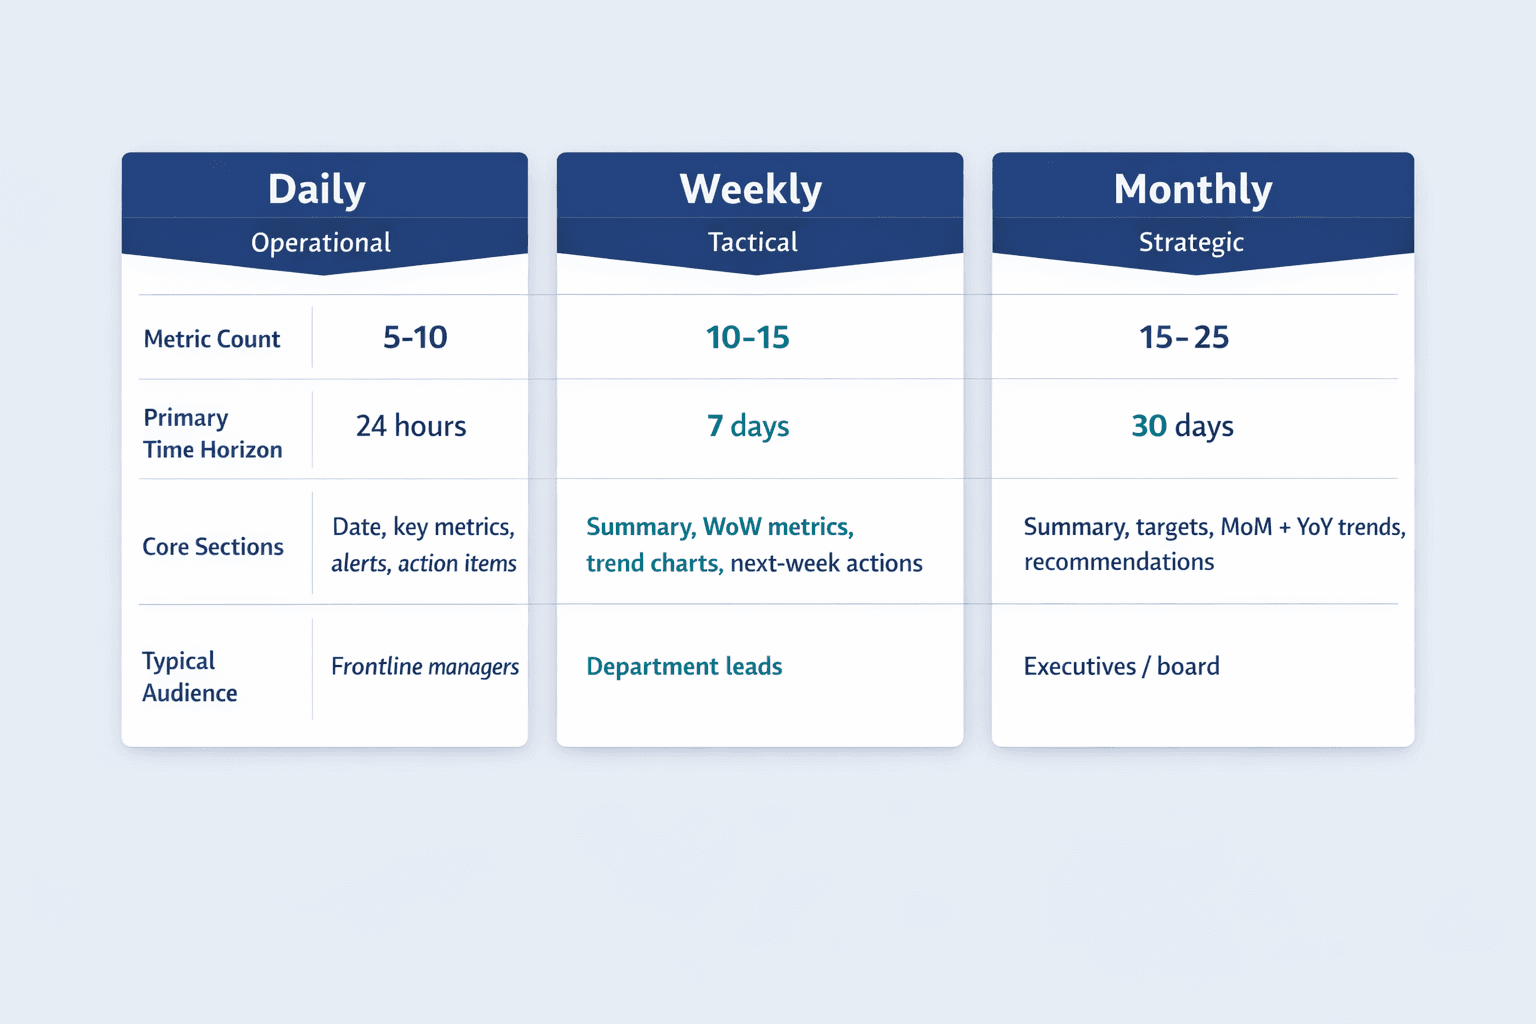
- Keep a narrow scope—typically 5-10 critical metrics maximum
- Drive tactical decisions and immediate corrective actions
- Present information in quick-glance format (one page or single dashboard)
- Track metrics that fluctuate day-to-day rather than remain stable for weeks
Sales teams use daily reports to monitor leads and conversion rates. Customer service managers track support ticket volume and response times. Operations teams watch production output and quality metrics. For fast-moving projects, daily reporting keeps everyone aligned on changing conditions that weekly snapshots might miss.
Common Metrics in Daily KPI Reports
Typical daily metrics include:
- Daily sales revenue and deal pipeline changes
- Website traffic and conversion rates
- Support tickets opened, closed, and first reply time
- Production output and manufacturing throughput
- Inventory levels and stockouts
- Daily active users and engagement metrics
- Campaign performance (ad spend, clicks, conversions)
- Cash position and payment collections
Choose daily metrics that pass the action test—if today’s number can’t change tomorrow’s decisions, it belongs in a weekly or monthly report instead.
Daily KPI Report Template
A daily KPI report template standardizes the reporting process so teams don’t build reports from scratch every morning. Templates reduce cognitive load, ensure consistency, and let teams focus on insights rather than formatting.
Essential Components of a Daily KPI Report Template
Include these sections in your daily template:
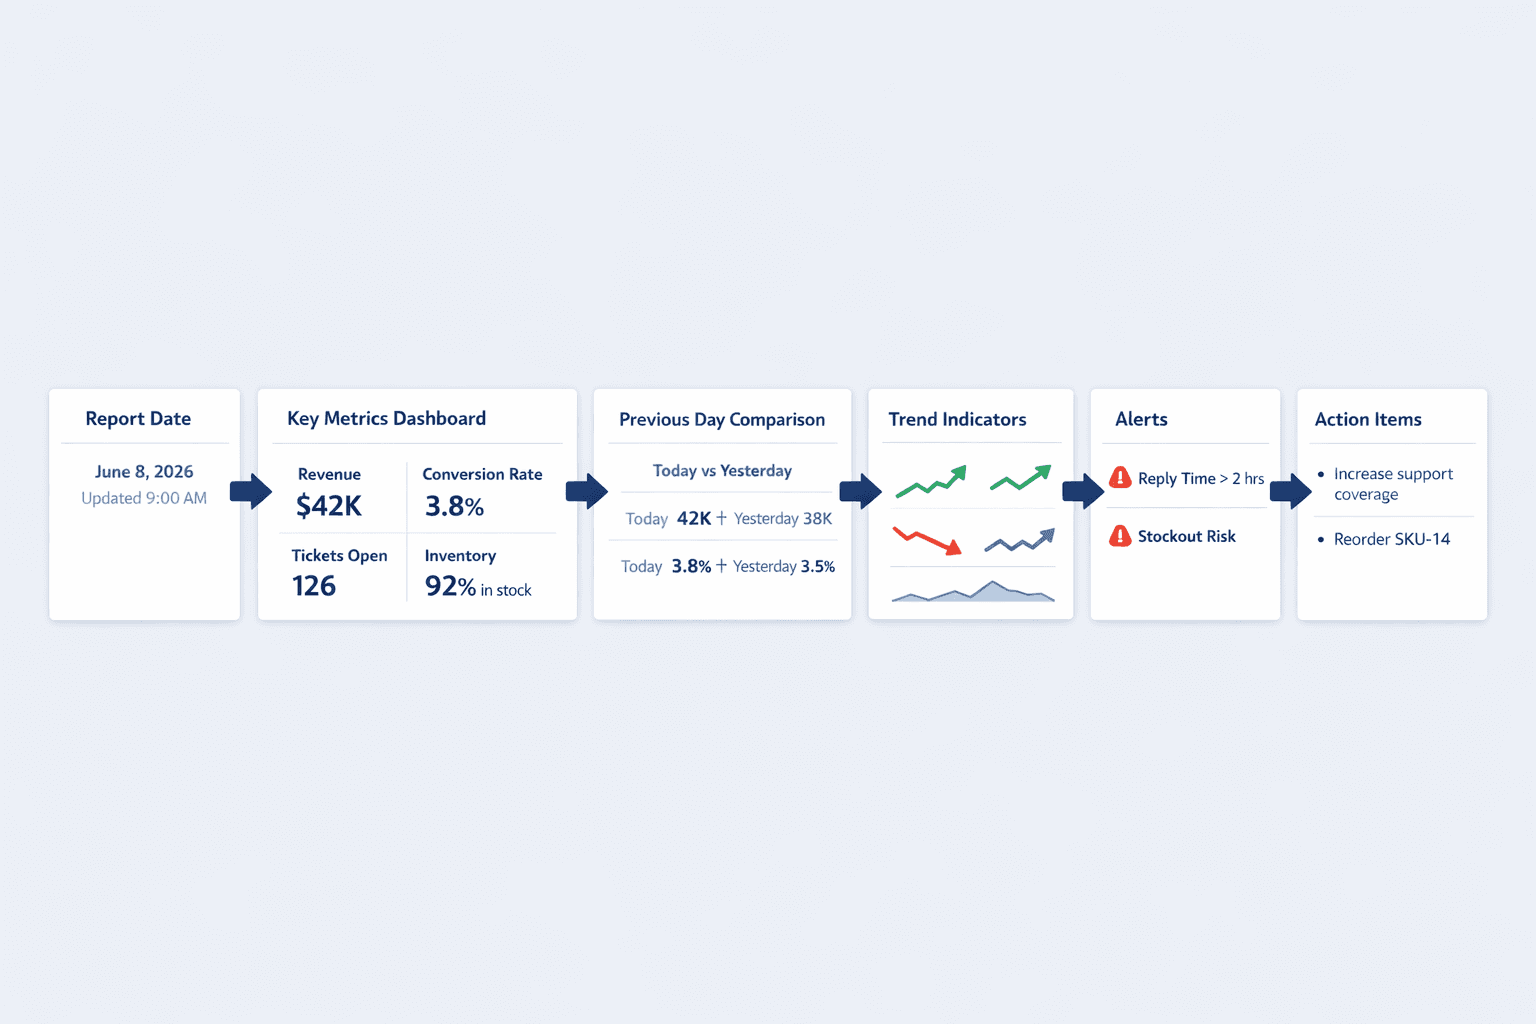
- Report date: Clear timestamp showing which day’s data you’re viewing
- Key metrics dashboard: Visual widgets showing current values for 5-10 critical metrics
- Previous day comparison: Yesterday’s values alongside today’s to spot immediate changes
- Trend indicators: Arrows or sparklines showing 3-7 day directional movement
- Alerts/thresholds breached: Automatic flagging when metrics hit predefined warning levels
- Quick action items: 2-3 sentence notes on what needs attention today
- Data source timestamps: Shows when each metric was last updated—critical for real-time reporting
Templates should flex to fit your business. A sales team might emphasize pipeline movement and conversion rates, while customer service focuses on ticket metrics and response times.
Daily Report Format Considerations
Keep daily reports scannable:
- Use visual indicators (red/yellow/green status) so readers process information instantly
- Keep it one-page whenever possible—executives should understand the situation in 30 seconds
- Prioritize scanability over detail—save comprehensive analysis for weekly/monthly reports
- Include only actionable metrics—if the reader can’t respond to it today, leave it out
- Automate data pulls where possible so reports generate without manual work
Report by exception—highlight metrics that are off-track rather than listing every green indicator.
What Is a Weekly KPI Report?
A weekly KPI report aggregates performance data over seven days to identify tactical trends and inform short-term adjustments. Weekly cadence reveals patterns that daily fluctuations obscure while catching issues before they become monthly surprises.
Key characteristics of weekly KPI reports:
- Broader scope than daily reports—typically 10-15 metrics across multiple areas
- Include trend analysis comparing this week to previous weeks
- Balance tactical and operational focus rather than pure strategic view
- Show week-over-week changes to surface momentum shifts
- Identify patterns that single-day snapshots miss
- Used for team performance reviews and sprint retrospectives
Department managers use weekly reports to review team performance and adjust priorities for the coming week. Project managers track sprint progress and milestone completion. Marketing teams analyze campaign performance after enough data accumulates to show meaningful trends.
Common Metrics in Weekly KPI Reports
Typical weekly metrics include:
- Weekly revenue and sales pipeline movement
- Customer acquisition and lead conversion rates
- Project milestones completed and sprint velocity
- Marketing campaign performance (impressions, clicks, conversions)
- Customer satisfaction scores and support metrics
- Team productivity metrics (tasks completed, story points delivered)
- Quality assurance results and defect rates
- Content performance (blog traffic, engagement rates)
Weekly reports show patterns that daily snapshots hide. A single bad day might be noise, but three consecutive weeks of declining conversion rates signal a real problem worth investigating.
Weekly KPI Report Template
A weekly KPI report template provides structure for week-over-week analysis and tactical planning. It’s more narrative than daily reports but more focused than monthly strategic reviews.
Essential Components of a Weekly KPI Report Template
Include these sections in your weekly template:
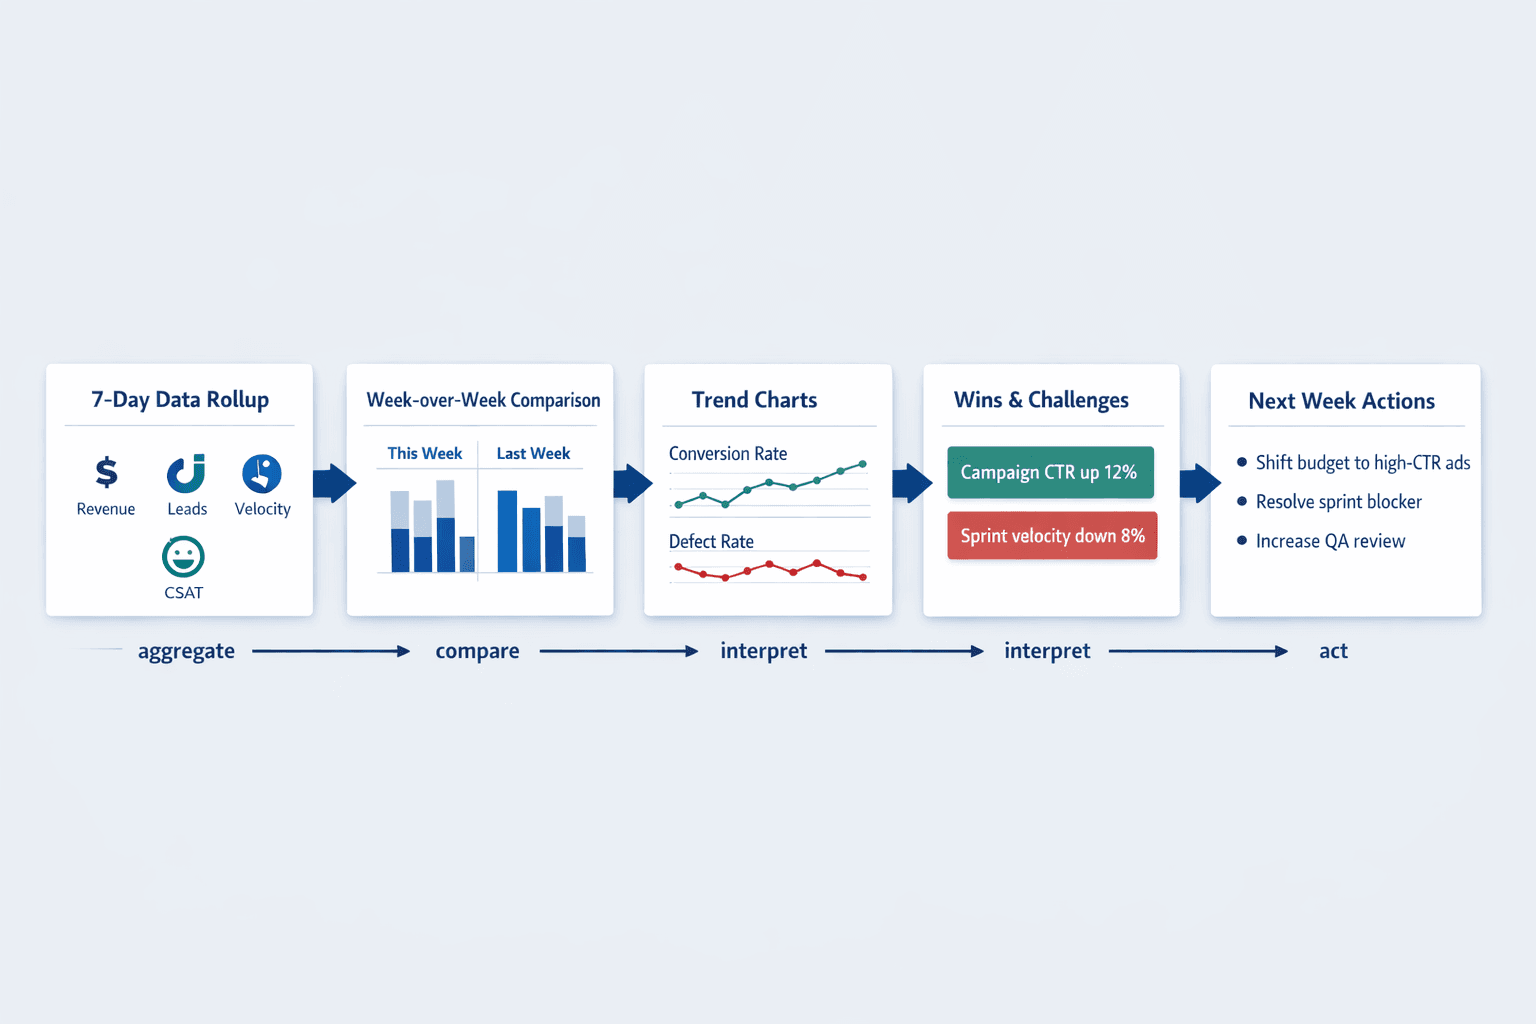
- Report week/date range: Clear start and end dates (e.g., “Week of June 2-8, 2026”)
- Executive summary: 2-3 sentence headline capturing the week’s key story
- Key metrics with week-over-week comparison: Core numbers alongside previous week’s values
- Trend charts: Visualizations showing 4-8 week patterns for critical metrics
- Goals vs actuals: Side-by-side comparison of targets and actual performance
- Wins and challenges: Brief narrative on what went well and what needs attention
- Action items for next week: 3-5 specific priorities based on this week’s data
- Supporting data tables: Detailed breakdowns for stakeholders who need deeper analysis
Weekly reports need more context than daily reports because the audience has broader responsibilities. A department head reviewing 5-10 teams needs enough detail to understand performance without drowning in operational minutiae.
Weekly Report Format Considerations
Make weekly reports informative but concise:
- Include trend visualizations—charts show patterns better than tables of numbers
- Show percentage changes from previous week to highlight acceleration or deceleration
- Highlight anomalies explicitly rather than burying them in dense data
- Group related metrics together (sales metrics in one section, operational metrics in another)
- Keep executive summary concise—save detailed analysis for the body sections
Weekly reports balance data and narrative. Pure numbers miss the “why,” but too much commentary buries the facts. Include enough context to explain significant changes without writing a novel.
What Is a Monthly KPI Report?
A monthly KPI report provides comprehensive analysis of performance over 30 days, focusing on strategic metrics and long-term trends. Monthly reports are the “workhorse” documents that connect daily execution to quarterly targets and show whether your business is on pace to hit annual goals.
Key characteristics of monthly KPI reports:
- Strategic focus on business health and direction rather than daily operations
- Comprehensive coverage—typically 15-25 metrics across all business areas
- Comparison to goals, targets, and prior periods (last month, same month last year)
- Include context and analysis explaining “why” behind the numbers
- Identify longer-term trend patterns that shorter periods miss
- Used for strategic decision-making, budget reviews, and board reporting
Executives review monthly reports to assess overall business performance. Board members use them to track progress against strategic plans. Finance teams analyze them for budget variance. Investors want monthly updates on company health and goal attainment.
Common Metrics in Monthly KPI Reports
Typical monthly metrics include:
- Monthly recurring revenue (MRR) and revenue growth rate
- Customer lifetime value and acquisition cost
- Churn rate and customer retention
- Market share changes and competitive position
- Profitability metrics (gross margin, EBITDA, net income)
- Strategic initiative progress and milestone completion
- Employee metrics (headcount, turnover rate, engagement scores)
- Progress toward annual goals (year-to-date performance vs. target)
Monthly reports focus on business health and strategic direction rather than operational firefighting. They answer “Are we on track to achieve our objectives?” rather than “What happened yesterday?”
Monthly KPI Report Template
A monthly KPI report template provides the framework for comprehensive business performance analysis. It’s the most detailed of the three report types and often serves as presentation material for executive meetings and board reviews.
Essential Components of a Monthly KPI Report Template
Include these sections in your monthly template:
- Report month/period: Clear date range and comparison context (e.g., “May 2026 vs. April 2026 vs. May 2025”)
- Executive summary: 3-5 sentence overview of the month’s key findings and implications
- Key performance highlights: Top 3-5 wins and 2-3 challenges worth executive attention
- Metrics vs targets table: All tracked KPIs with current values, targets, and status indicators
- Month-over-month comparison: Sequential comparison showing momentum and velocity changes
- Year-over-year comparison: Same-period prior-year comparison to identify seasonal patterns and growth
- Trend analysis with visualizations: Charts showing 6-12 month patterns for strategic metrics
- Departmental breakdowns: Section-by-section deep dives for each functional area
- Strategic insights and recommendations: Analysis of what the data means and what actions to take
- Forward-looking projections: Forecasts or predictions for upcoming months based on current trends
Monthly reports are typically the most comprehensive and include narrative analysis. While daily reports say “here’s what happened,” and weekly reports say “here’s the pattern,” monthly reports answer “here’s what it means and what we should do about it.”
Monthly Report Format Considerations
Make monthly reports thorough but accessible:
- Include both summary and detailed views—executives want headlines, operators need specifics
- Use professional visualizations that tell clear stories without requiring data science degrees
- Provide context for variances—explain why metrics moved, not just that they moved
- Include year-to-date tracking so readers see progress toward annual goals
- Add commentary explaining trends—pure numbers without interpretation miss the point
- Make it presentation-ready so executives can share it with boards or investors without reformatting
Even comprehensive monthly reports should lead with a one-page summary. Standardized format and consistent structure make monthly reports easier to digest despite their depth.
KPI Monthly Report Template
“KPI monthly report template” and “monthly KPI report template” mean the same thing—they both refer to the standard structure for tracking and analyzing performance over a 30-day period. Some organizations prefer one phrase over the other, but the content and purpose are identical.
For complete information on what to include in your template and how to structure monthly KPI reports, see the previous section on Monthly KPI Report Template.
Choosing the Right Reporting Frequency
Different metrics and audiences require different reporting cadences. The right frequency balances timeliness with effort—reporting too often creates noise and busywork, while reporting too infrequently misses critical signals.
| Aspect | Daily Reports | Weekly Reports | Monthly Reports |
|---|---|---|---|
| Purpose | Operational monitoring | Tactical adjustment | Strategic analysis |
| Audience | Frontline managers, operations teams | Department managers, project leads | Executives, board members, investors |
| Typical Metrics | Sales pipeline, support tickets, production output, website traffic | Revenue, project progress, campaign performance, team productivity | MRR, churn, profitability, strategic goals, employee metrics |
| Level of Detail | High operational detail, narrow scope | Moderate detail, trend context | Comprehensive analysis, strategic context |
| Time Investment | 15-30 minutes to review | 1-2 hours to prepare and review | 4-8 hours to prepare and review |
| Best Use Cases | Fast-changing metrics requiring immediate response | Metrics that show weekly patterns, team performance reviews | Business health assessment, strategic planning, board reporting |
When to Use Multiple Reporting Frequencies
Many organizations use multiple cadences for different purposes:
- Different departments have different needs: Sales might need daily pipeline updates while HR reviews hiring metrics monthly
- Metrics roll up from daily to monthly: Individual daily sales numbers aggregate into weekly revenue and monthly recurring revenue
- Executive vs operational audiences: Operations needs daily details, executives want monthly strategic summaries
- Fast-moving vs slow-moving metrics: Support ticket volume changes daily; employee turnover shows meaningful patterns only over months
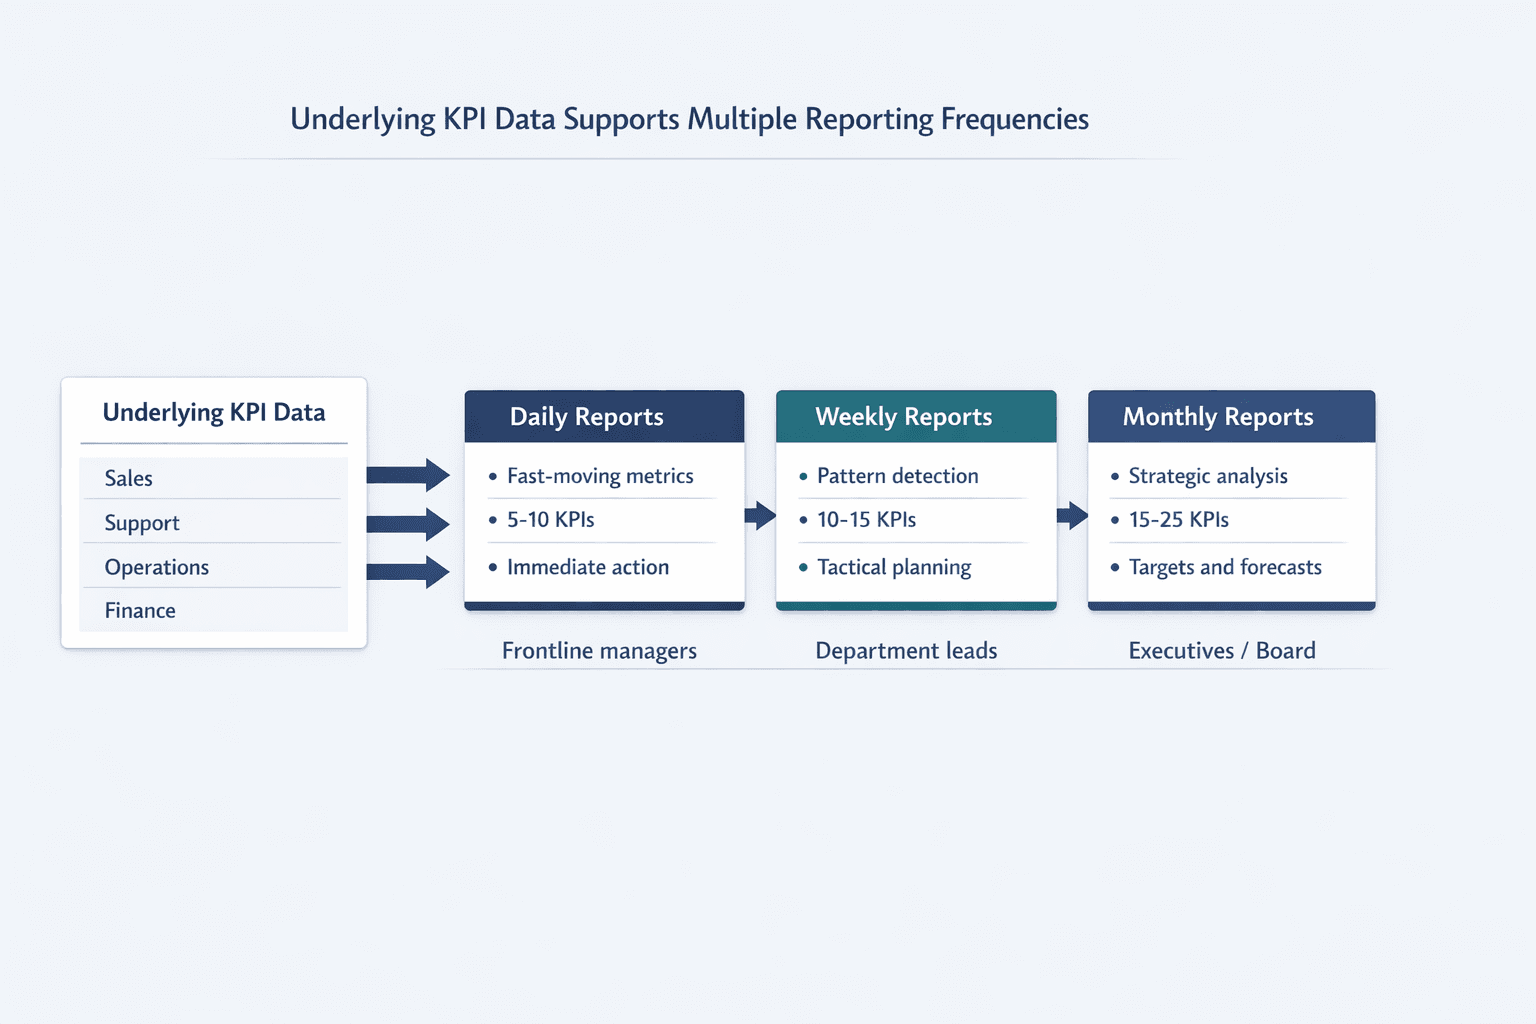
Daily, weekly, and monthly reports should align and tell a cohesive performance story. The same underlying data feeds all three reporting cadences—you’re just changing the time horizon and level of analysis based on what different audiences need to make decisions.
FAQ
How Often Should KPI Reports Be Created?
It depends on metric volatility and decision-making needs. Operational metrics that change hourly or daily—like support tickets, website traffic, or production output—need daily tracking so managers can respond immediately. Tactical metrics that show meaningful patterns over days—like weekly sales, project velocity, or campaign performance—work well in weekly reports. Strategic metrics that indicate business health—like monthly recurring revenue, churn rate, or profitability—should be tracked monthly to inform longer-term decisions without getting lost in daily noise.
Can One Template Work for Daily, Weekly, and Monthly Reports?
While the core structure is similar, each frequency requires different components. Daily reports need extreme brevity and focus on immediate actions—think one-page dashboards with just the critical numbers and red/yellow/green status indicators. Weekly reports need trend context and comparison—typically 2-3 pages with charts showing 4-8 week patterns and brief narrative on wins and challenges. Monthly reports need comprehensive analysis—often 5-10 pages with detailed breakdowns, strategic commentary, and forward-looking projections. One generic template rarely serves all three purposes equally well.
What's the Difference Between a KPI Report and a Dashboard?
Dashboards provide real-time views of current performance while reports are point-in-time snapshots with analysis. Dashboards update automatically and show “what’s happening right now”—they’re designed for continuous monitoring. Reports capture performance at a specific moment (end of day, end of week, end of month) and include context, commentary, and recommendations that dashboards typically lack. Reports tell the story behind the numbers rather than just displaying them.
How Many KPIs Should Be in Each Report Type?
Daily reports should track 5-10 critical metrics—any more than that and you lose focus on what actually needs immediate attention. Weekly reports can handle 10-15 metrics since they’re providing broader tactical context without the urgency of daily monitoring. Monthly reports typically include 15-25 metrics depending on organization size and complexity. McKinsey recommends three to eight KPIs at a given organizational level for performance management—the principle is focus over comprehensiveness. More metrics don’t mean better reporting; they often just mean more noise.