Sales Analysis: Methods, Metrics and Examples
Discover how to analyze sales data by examining performance across products, territories, and time periods—without drowning in spreadsheets or guessing which metrics matter.
Quick Verdict
Sales analysis is the systematic evaluation of sales data to understand performance, identify trends, and make informed business decisions. It transforms raw transaction records, pipeline activity, and customer behavior into actionable insights that drive strategy.
Why does it matter? Because sales data alone doesn’t tell you what to do next. 70% of sales reps’ time goes to non-selling activities—and without disciplined analysis, you’re flying blind on which activities actually produce revenue. Sales analysis connects the dots between effort and results, helping you optimize territory assignments, fix pipeline bottlenecks, and forecast accurately.
This guide covers the core methods used in sales analysis, key metrics worth tracking, different analytical approaches for different business questions, and real-world examples that show how analysis translates to better decisions.
What Is Sales Analysis?
Sales analysis is the process of examining sales performance data across products, territories, time periods, and customer segments to identify patterns and opportunities. It’s how you figure out what’s working, what’s not, and where to focus next.
Here’s what sales analysis covers:
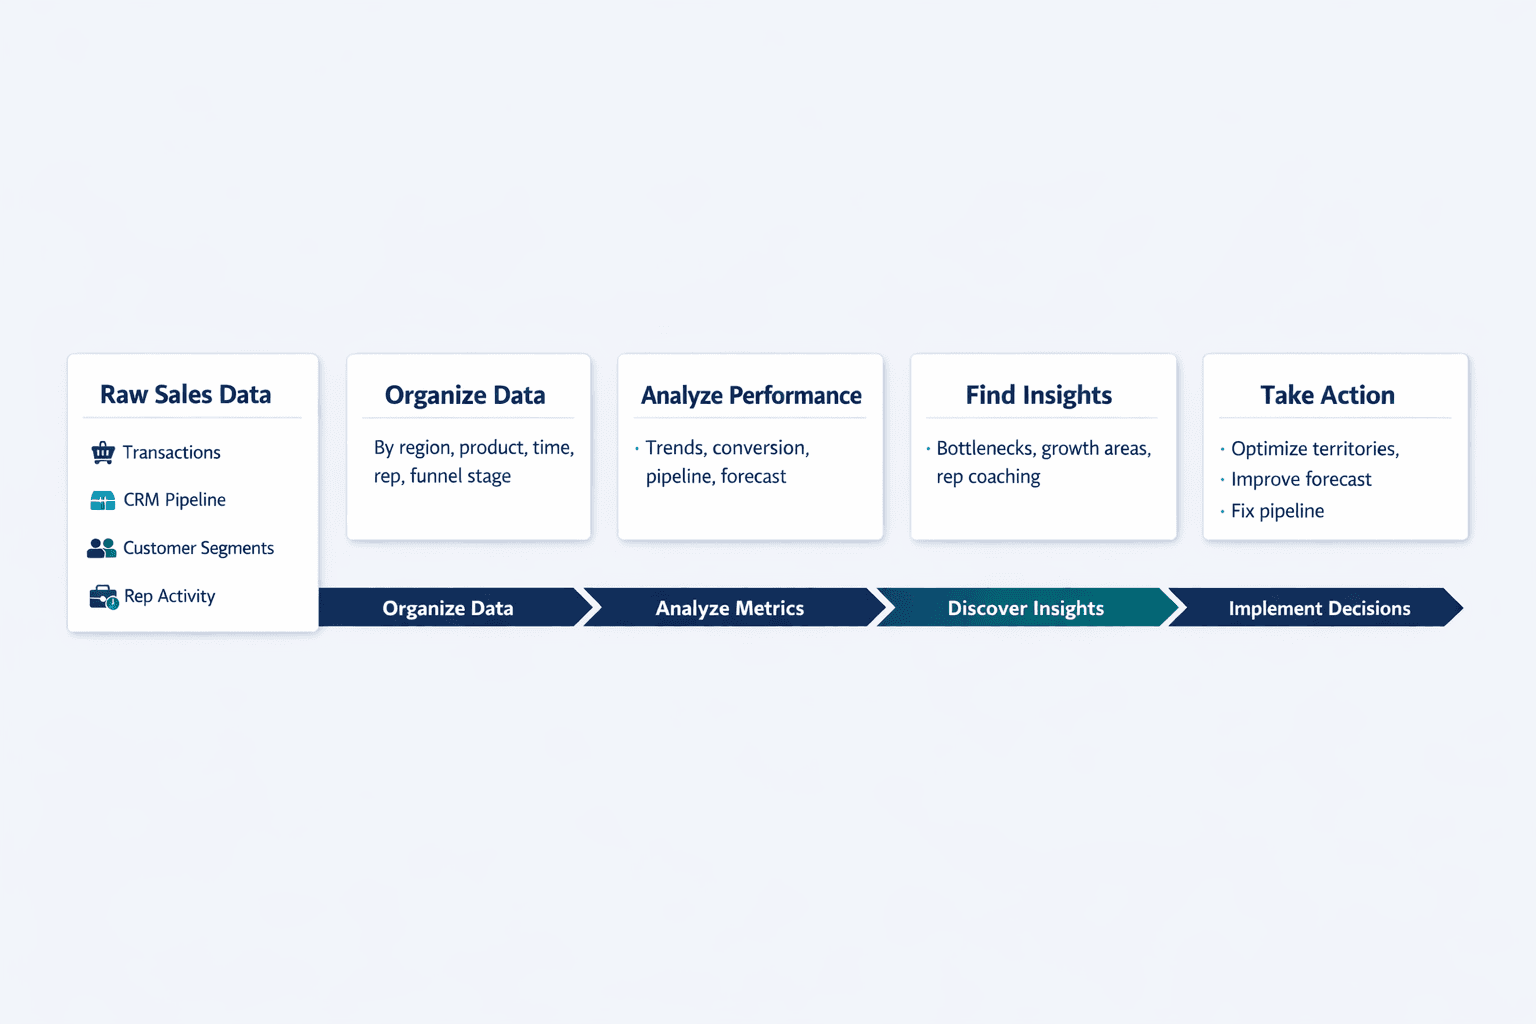
- What data is collected — Transaction records, CRM pipeline stages, customer demographics, product performance, sales rep activity, conversion rates, and deal velocity
- How it’s organized — By region, product line, time period, customer segment, sales rep, or funnel stage to enable apples-to-apples comparisons
- What questions it answers — Are we hitting targets? Which products are growing? Where are deals stalling? Which reps need coaching? What’s our forecast accuracy?
- Who uses it — Sales leaders for strategy and resource allocation; reps for pipeline management and target tracking; executives for growth planning and investor reporting
- When it’s performed — Weekly for pipeline health; monthly for quota attainment; quarterly for territory planning; annually for trend analysis and strategic planning
- Why it matters for growth — Because you can’t improve what you don’t measure—sales teams using AI are more likely to post revenue increases than teams relying on gut instinct alone
Sales analysis differs from general business analytics in its laser focus on revenue-generating activities and sales team performance. While business analytics might examine website traffic or customer support ticket resolution times, sales analysis zeroes in on deal flow, conversion rates, and quota attainment.
Sales Data Analysis
Sales data analysis is the technical process of collecting, cleaning, organizing, and interpreting raw sales information to extract meaningful insights. It’s the engine room where messy data becomes clear direction.
Types of Sales Data Analyzed
Sales analysis draws on multiple data types to build a complete picture:
- Transaction records — Invoice data, payment history, deal size, product mix, discounting patterns
- Customer information — Company size, industry, location, decision-maker roles, purchase history, lifetime value
- Product performance — Units sold, revenue by SKU, margin by product line, cross-sell and upsell patterns
- Sales rep activity — Call volume, email cadence, demo count, meetings scheduled, tasks completed
- Pipeline metrics — Stage progression, conversion rates by stage, time in stage, deal velocity, pipeline coverage ratio
- Conversion rates — Lead-to-opportunity, opportunity-to-close, stage-to-stage transitions, win rates by segment
- Deal velocity — Average sales cycle length, time to first contact, time to proposal, time to close
- Customer acquisition costs — Marketing spend per closed deal, sales rep cost per deal, total CAC by channel or segment
Common Sales Data Analysis Methods
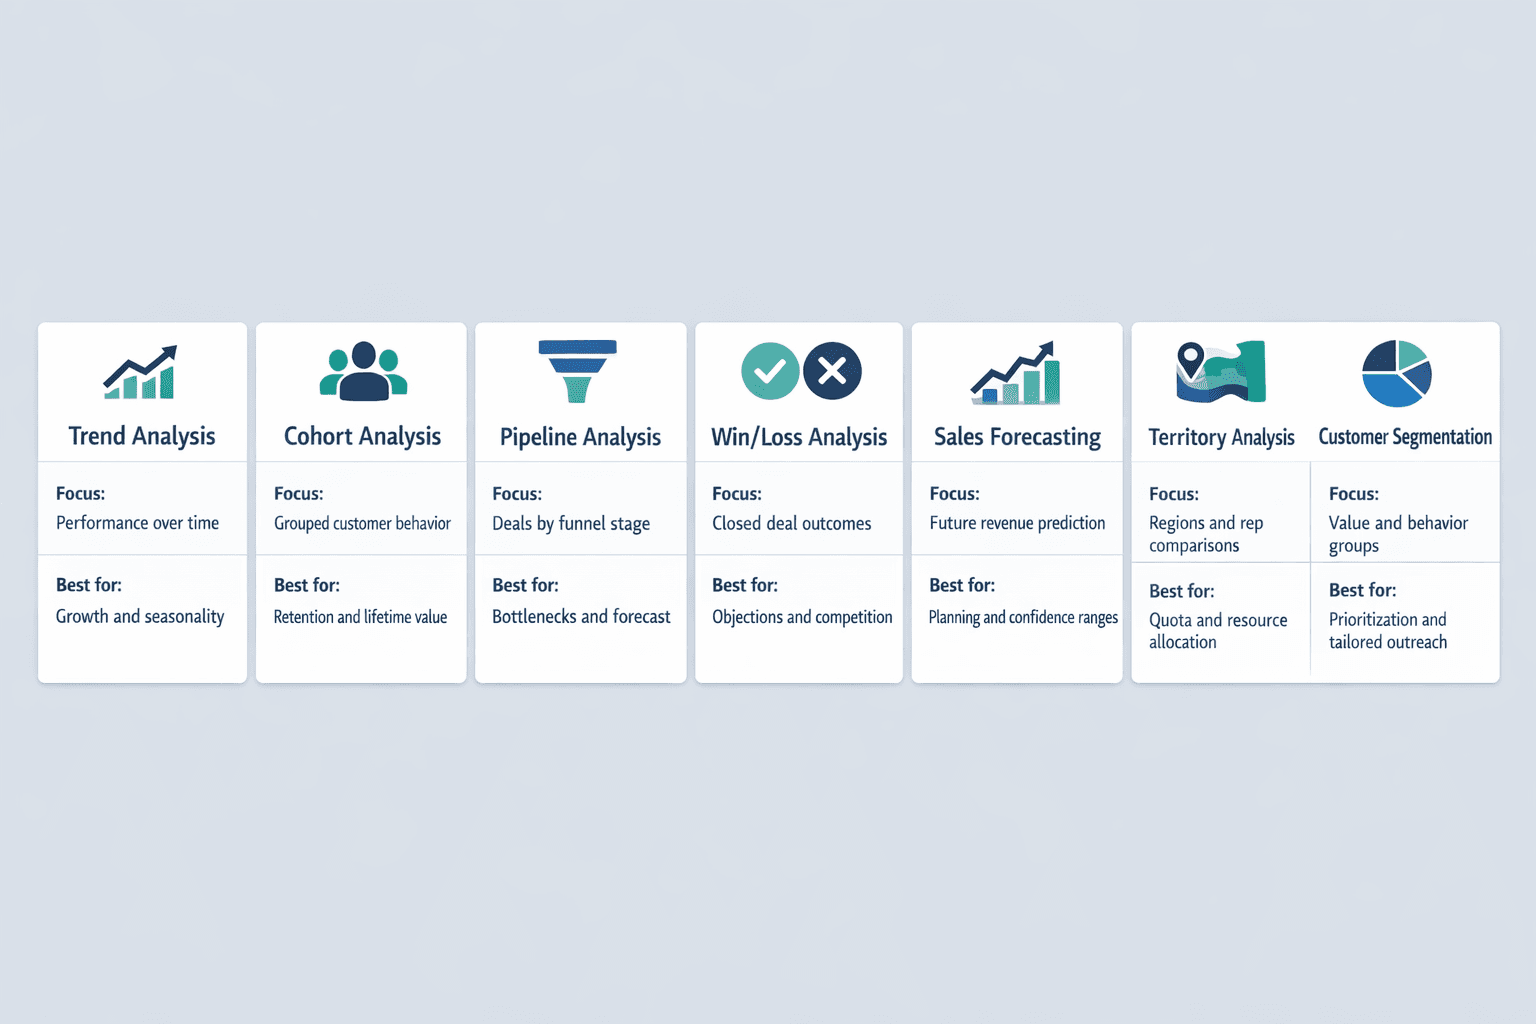
Different business questions require different analytical approaches:
- Trend analysis — Tracks sales performance over time to spot growth, decline, or seasonal patterns—useful for budgeting and capacity planning
- Cohort analysis — Groups customers by shared characteristics (signup month, acquisition channel, product tier) to measure retention and lifetime value
- Pipeline analysis — Examines deals in various funnel stages to forecast revenue, identify conversion bottlenecks, and assess pipeline health
- Win/loss analysis — Reviews closed deals to understand why opportunities were won or lost, revealing competitive positioning and messaging effectiveness
- Sales forecasting — Uses historical data and pipeline coverage to predict future revenue with defined confidence intervals
- Territory analysis — Compares performance across regions or sales reps to optimize resource allocation and quota setting
- Customer segmentation — Divides customers into groups by behavior, value, or characteristics to tailor outreach and prioritize accounts
Key Metrics in Sales Data Analysis
Here are the essential metrics that connect sales activity to business outcomes:
| Metric | What It Measures | Why It Matters | Typical Calculation |
|---|---|---|---|
| Win Rate | Percentage of opportunities closed-won | Indicates sales effectiveness and competitive strength | Closed-won deals ÷ Total closed deals |
| Sales Conversion Rate | Percentage of prospects taking a desired action | Shows funnel efficiency at each stage | Conversions ÷ Total prospects × 100 |
| Pipeline Coverage Ratio | Total pipeline value relative to revenue target | Assesses forecast confidence and capacity | Pipeline value ÷ Revenue target |
| Average Deal Size | Mean revenue per closed deal | Influences quota setting and territory planning | Total revenue ÷ Number of deals |
| Sales Cycle Length | Average time from first contact to close | Affects cash flow forecasting and capacity planning | Sum of days to close ÷ Number of deals |
| Sales Velocity | Speed at which pipeline converts to revenue | Combines opportunity count, deal size, win rate, and cycle time | (Opportunities × Avg deal value × Win rate) ÷ Cycle length |
| Customer Acquisition Cost | Total cost to acquire one customer | Determines profitability and marketing efficiency | (Sales + Marketing spend) ÷ New customers |
| Monthly Recurring Revenue | Predictable monthly income from subscriptions | Tracks growth and revenue stability for SaaS businesses | Sum of monthly subscription revenue |
| Quota Attainment | Percentage of reps hitting their targets | Measures sales team health and quota realism | Reps meeting quota ÷ Total reps × 100 |
| Revenue per Rep | Average revenue generated per salesperson | Guides hiring decisions and productivity benchmarking | Total revenue ÷ Number of sales reps |
These metrics connect directly to strategic decisions. For example, many successful sales organizations maintain pipeline coverage ratios between 3:1 and 5:1—if your ratio drops below 3:1, you likely need more lead generation or earlier-stage activity.
Pipeline coverage of $500,000 against a $100,000 target gives you a 5:1 ratio—comfortable breathing room if your win rate is 20-25%. But if data quality issues inflate your pipeline with stale or unqualified deals, your forecast will miss the mark.
Sales Analysis Software
Sales analysis software automates data collection, visualization, and reporting to make analysis faster and more accessible. Instead of manually exporting CRM data into spreadsheets, modern tools connect directly to your data sources and update dashboards in real time.
Features of Sales Analysis Software
Core capabilities worth looking for:
- Data integration — Connects to CRM, ERP, marketing automation, and payment systems to unify sales data from multiple sources
- Dashboard creation — Build visual displays of KPIs tailored to different roles (reps see pipeline, VPs see forecast accuracy)
- Automated reporting — Schedule weekly pipeline reviews, monthly quota reports, or quarterly trend summaries without manual work
- Predictive analytics — Forecasts revenue based on historical patterns, deal attributes, and pipeline coverage
- Visualization tools — Charts, graphs, heatmaps, and geographic overlays that make patterns obvious at a glance
- Real-time monitoring — Live updates as deals move through stages, eliminating the lag of batch reporting
- Custom metric tracking — Define your own KPIs beyond standard metrics to match your sales process
- Team collaboration features — Shared dashboards, annotations, and alerts so everyone works from the same data
The best tools blend CRM pipeline data with ERP actuals rather than relying on spreadsheets alone—this combination improves forecast quality and reduces the time sales leaders spend reconciling numbers.
Types of Sales Analysis Software
The software landscape breaks into a few categories, each with different strengths:
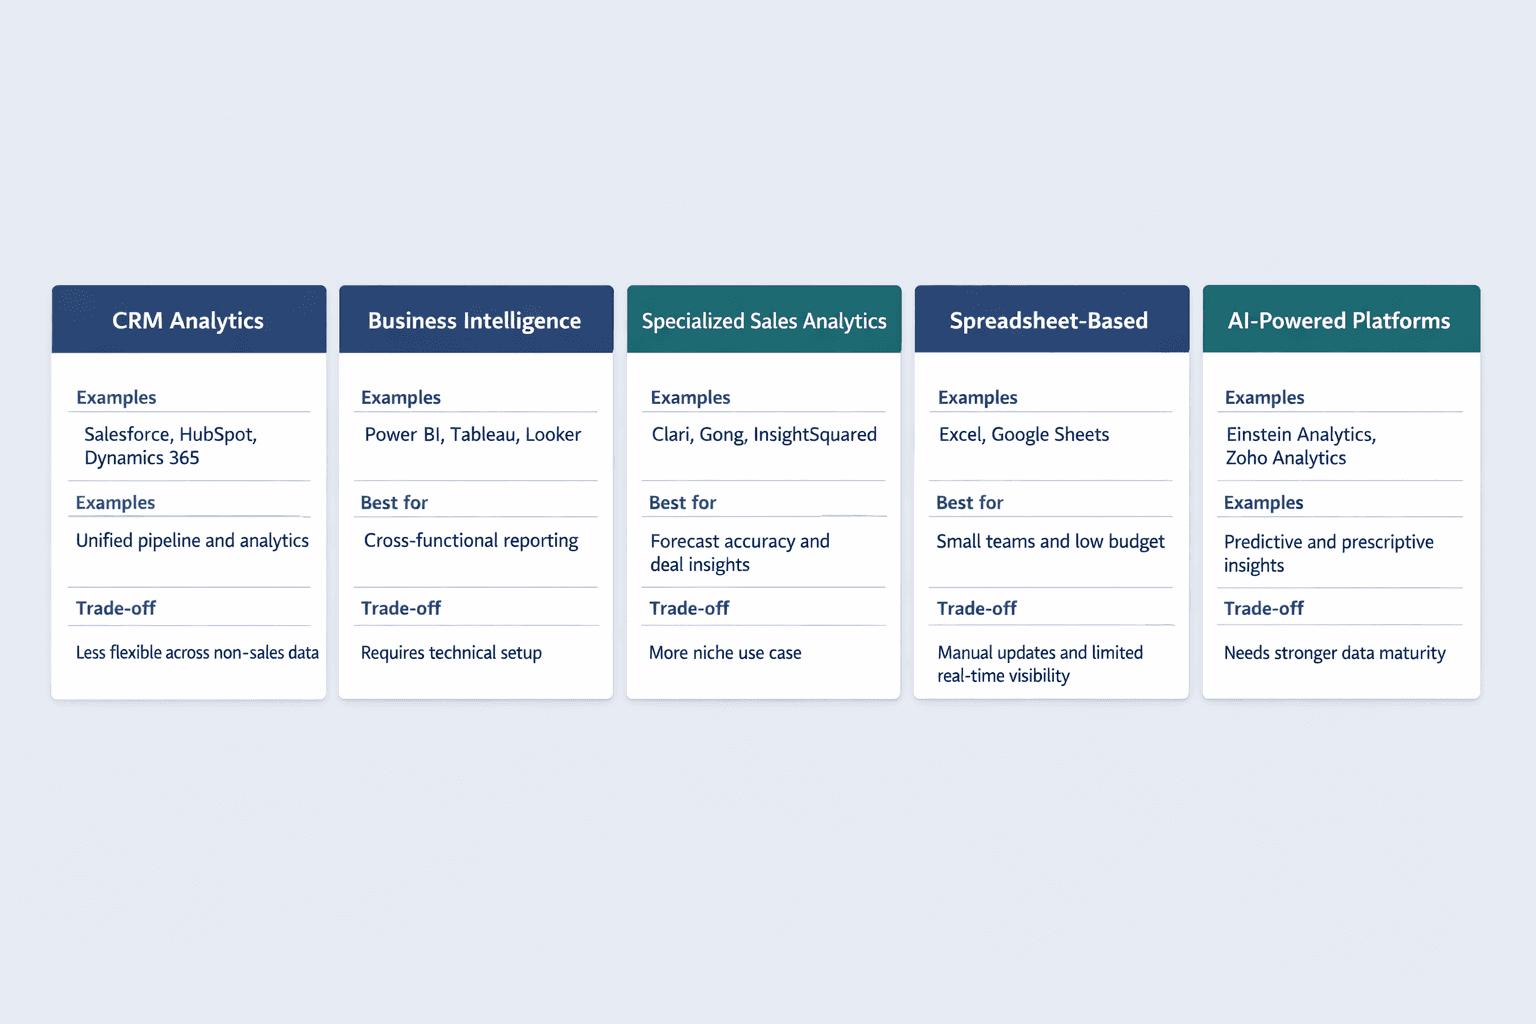
- CRM platforms with built-in analytics — Salesforce Sales Cloud, HubSpot Sales Hub, Microsoft Dynamics 365 Sales—best for teams that want analytics and pipeline management in one place without switching tools
- Business intelligence tools — Power BI, Tableau, Looker—best for organizations that need cross-functional reporting beyond sales (finance, marketing, operations) and have technical resources to build custom dashboards
- Specialized sales analytics software — Clari, Gong Revenue Intelligence, InsightSquared—best for sales-first organizations that need deal-level insights, conversation intelligence, and forecast accuracy as primary use cases
- Spreadsheet-based solutions — Excel with Power Query, Google Sheets with add-ons—best for small teams with simple reporting needs and limited budget, though they require manual updates and lack real-time monitoring
- AI-powered analysis platforms — Einstein Analytics, Zoho Analytics with AI—best for teams ready to move beyond descriptive reporting into predictive forecasting and prescriptive recommendations
81% of sales teams are experimenting with or have fully implemented AI, which explains the growing category of AI-powered platforms that surface insights automatically instead of waiting for analysts to run queries.
Popular Sales Analysis Software Examples
| Software | Best Suited For | Key Features | Starting Price Range | Integration Capabilities |
|---|---|---|---|---|
| Power BI | SMBs to enterprise | Report creation, data refresh, dataset sharing, model customization | Free tier available; Pro $14/user/month | Connects to 100+ data sources including Dynamics, Excel, SQL Server |
| Salesforce Sales Cloud | Mid-market to enterprise B2B | Embedded forecasting, pipeline reporting, Einstein Analytics AI, quota management | Custom pricing (typically $75-150/user/mo) | Native integration with Salesforce ecosystem, REST API for external tools |
| Tableau | Mid-market to enterprise | Forecast dashboards, pipeline health views, territory optimization, self-service reporting | Contact sales for pricing | 70+ native connectors including major CRMs and ERPs |
| HubSpot Sales Hub | SMBs and growth-stage B2B | Pipeline analytics, deal tracking, email tracking, custom reporting | Free tier available; Professional $1,780/mo (5 seats) | Native HubSpot ecosystem, Zapier, API access |
| Oracle Sales Planning | Enterprise with complex planning | Quota planning, predictive forecasting, territory assignment, rolling forecasts | Contact sales for pricing | Oracle ERP Cloud, Oracle CX Cloud, major CRM systems |
Different tools solve different problems. Power BI works well for teams comfortable building their own reports. Salesforce Sales Cloud makes sense if your sales process already lives in Salesforce. Tableau excels at visualizing complex datasets for executive audiences. The right choice depends on your team size, technical resources, and whether you need sales-specific features or broader business intelligence.
Retail Sales Analysis
Retail sales analysis is the specialized examination of sales data in retail environments, focusing on store performance, product movement, seasonal patterns, and customer behavior. Unlike B2B sales analysis that tracks individual deals and rep activity, retail analysis looks at aggregate transaction patterns across locations, categories, and time periods.
Unique Aspects of Retail Sales Analysis
Retail introduces specific considerations not found in other sales contexts:
- Point-of-sale data — Real-time transaction capture at checkout creates granular datasets covering item-level sales, payment methods, timestamps, and basket composition
- Inventory turnover — Sales analysis directly informs restocking decisions—low turnover ratios can signal weak sales or deliberate stock build-up ahead of demand spikes
- Foot traffic patterns — Store visit conversions connect digital advertising to in-store purchases, measuring how ads influence physical store traffic
- Basket analysis — Examining which products are purchased together reveals cross-sell opportunities and guides store layout decisions
- Store location performance — Comparing sales per square foot or same-store sales across geographies identifies top-performing formats and expansion opportunities
- Seasonal fluctuations — Retail sales swing dramatically by season, requiring retail calendars like 4-5-4 or 5-4-4 to make year-over-year comparisons meaningful
- Promotional effectiveness — Measuring incremental lift from discounts, BOGO offers, or loyalty programs to calculate true ROI on promotional spend
Retail Sales Analysis Methods
Analytical approaches tailored to retail contexts:
- Sales per square foot analysis — Calculates revenue density to compare store efficiency and justify real estate decisions
- Same-store sales comparison — Measures year-over-year performance for locations open continuously, excluding new or closed stores that aren’t truly comparable
- Basket analysis — Uses association rules or clustering to identify purchase patterns like “customers who buy X also buy Y”
- Customer traffic analysis — Combines foot traffic counts with conversion rates and average order value to optimize staffing and layout
- Promotional lift analysis — Isolates incremental sales attributable to promotions versus baseline sales—many retailers still rely on basic lift calculations without accounting for cannibalization or category effects
- Category performance analysis — Tracks margin, turnover, and sales velocity by product category to prioritize floor space and inventory investment
Key Retail Metrics
Retail-specific metrics worth tracking:
- Average transaction value — Average amount a customer spends per order, calculated as total revenue ÷ number of transactions
- Units per transaction — Basket size measured as total units sold ÷ total transactions
- Conversion rate — Percentage of store visitors who make a purchase—a headline metric but should be interpreted alongside average order value
- Sales per square foot — Revenue generated per unit of retail space, useful for comparing store formats or locations
- Inventory turnover ratio — Cost of sales ÷ average inventory value, measuring how quickly stock moves
- Gross margin return on investment — Gross margin dollars earned per dollar of inventory investment
- Same-store sales growth — Year-over-year revenue change for locations open continuously in both periods
- Customer traffic count — Total visitors entering the store, regardless of purchase
Retail Sales Analysis Example
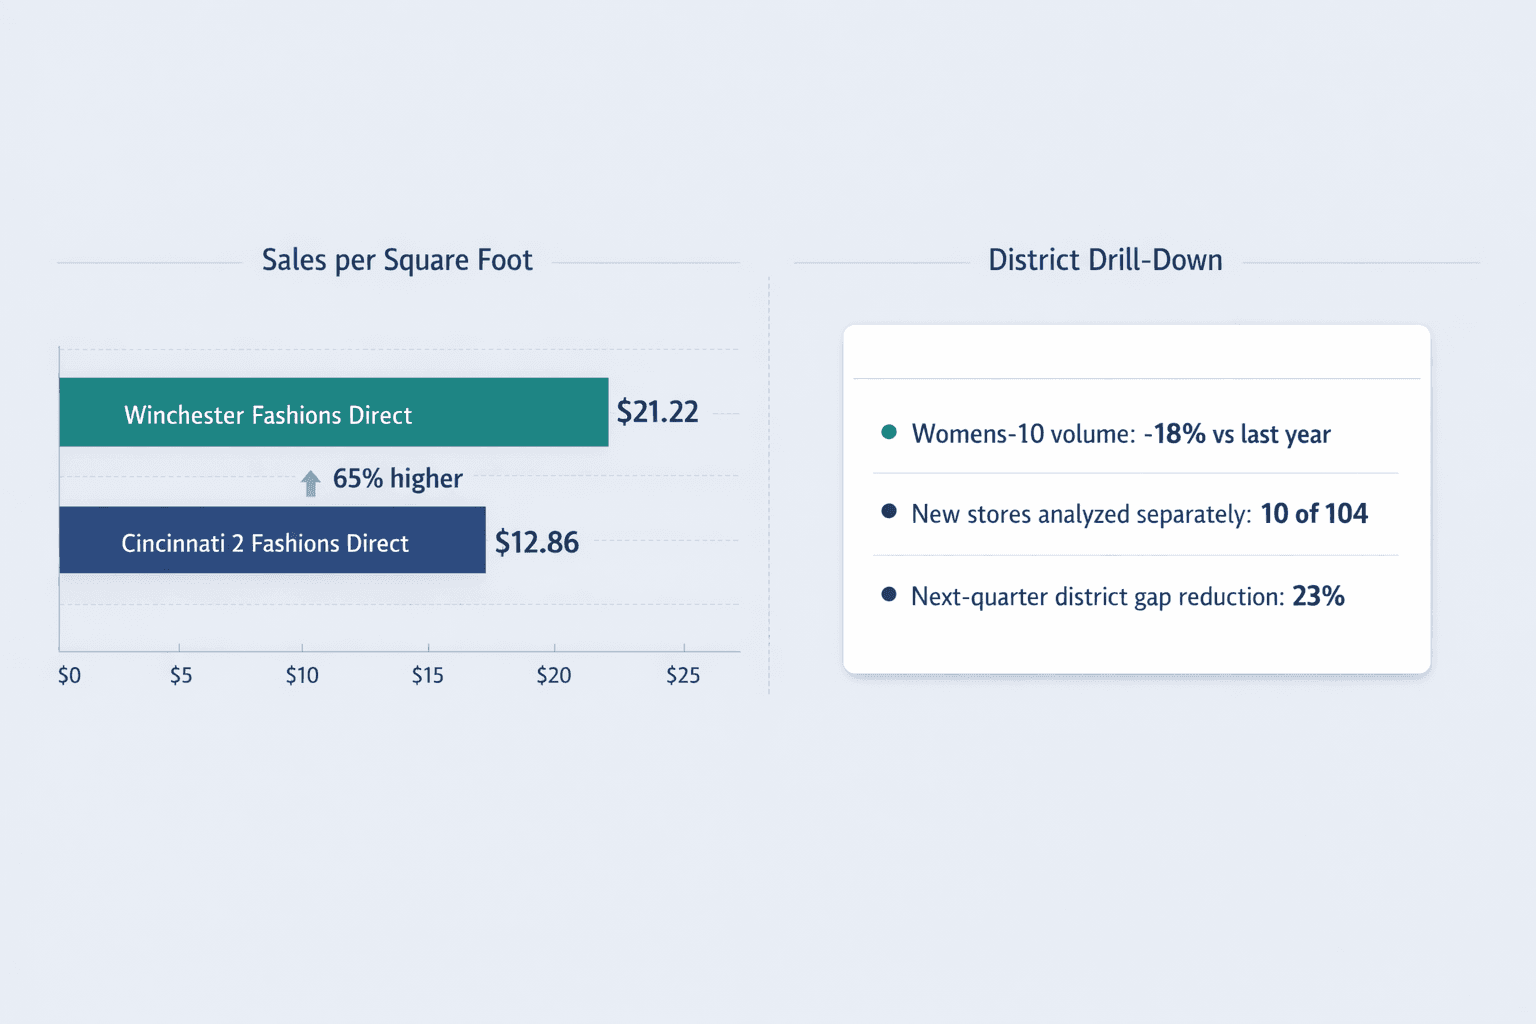
A regional fashion retailer with 104 stores—10 of them newly opened—wanted to understand why district-level performance varied so widely. The analysis covered a full fiscal year.
- Data collected: Point-of-sale transactions, store square footage, district assignments, product categories, year-over-year sales, and new-store flags
- Method applied: Same-store sales comparison and sales per square foot analysis
- Insights discovered: Among new stores in the same chain, Winchester Fashions Direct generated $21.22 per square foot while Cincinnati 2 Fashions Direct generated only $12.86—a 65% difference. Drilling into one underperforming district revealed that the Womens-10 category lagged last year’s volume by 18%, suggesting either inventory issues or local demographic shifts.
- Actions taken: Reallocated inventory toward top-performing categories in struggling districts; adjusted staffing ratios based on traffic-to-sales conversion rates; flagged the Cincinnati 2 location for real estate review
- Results achieved: District performance gaps narrowed by 23% in the following quarter, and overall same-store sales improved 4.1% year-over-year
What made this analysis effective was the willingness to exclude non-comparable data. New stores were analyzed separately from established locations, and product-category performance was examined at the district level—not just chain-wide—to surface localized issues.
Sales Analysis Methods and Examples
Different business questions require different analytical approaches. A sales leader forecasting quarterly revenue uses pipeline analysis. A VP optimizing territory assignments relies on comparative analysis. A product manager figuring out which SKUs to discontinue needs product-level trend analysis.
Here’s how the core methods work in practice.
Trend Analysis
Trend analysis identifies patterns in sales performance over time to spot growth, decline, or cyclical fluctuations. It answers questions like: Are we growing? Is growth accelerating or slowing? Do we have seasonal peaks?
Example: A B2B software company analyzed monthly recurring revenue over 18 months to identify growth trajectory and seasonal patterns. They tracked new MRR, expansion MRR, contraction MRR, and churn MRR by month. The analysis revealed that Q4 consistently delivered 35% higher new bookings than Q2, driven by year-end budget spending. It also showed that customer expansion (upsells) peaked 9-12 months after initial purchase, suggesting an optimal window for account management outreach. Armed with this insight, the company shifted 20% of sales capacity toward Q4 prospecting and built a structured expansion playbook timed to the 9-month mark.
Comparative Analysis
Comparative analysis compares sales performance across different dimensions—products, regions, reps, or time periods—to identify top performers and underperformers. It’s how you figure out which segments deserve more resources.
Example: A national distributor serving 12 regions compared year-over-year sales growth, average deal size, and win rate by territory. Three regions underperformed the national average by more than 15%, but the root causes varied. Region A had strong pipeline coverage but a 22% win rate versus 41% nationally—a competitive positioning problem. Region B had a win rate in line with peers but only 1.8:1 pipeline coverage—a lead generation problem. Region C had both low coverage and low win rates—a talent problem. The company reassigned top-performing reps to Region C, increased marketing spend in Region B, and ran competitive battle cards and objection-handling workshops in Region A. The result: all three regions returned to within 5% of the national average within two quarters.
Optimizing territory design can increase sales by 2% to 7% without adding headcount—but you can’t optimize what you don’t measure.
Pipeline Analysis
Pipeline analysis examines deals in various stages of the sales funnel to forecast revenue and identify bottlenecks. It tells you whether you have enough pipeline to hit your target, where deals are stalling, and which stages need attention.
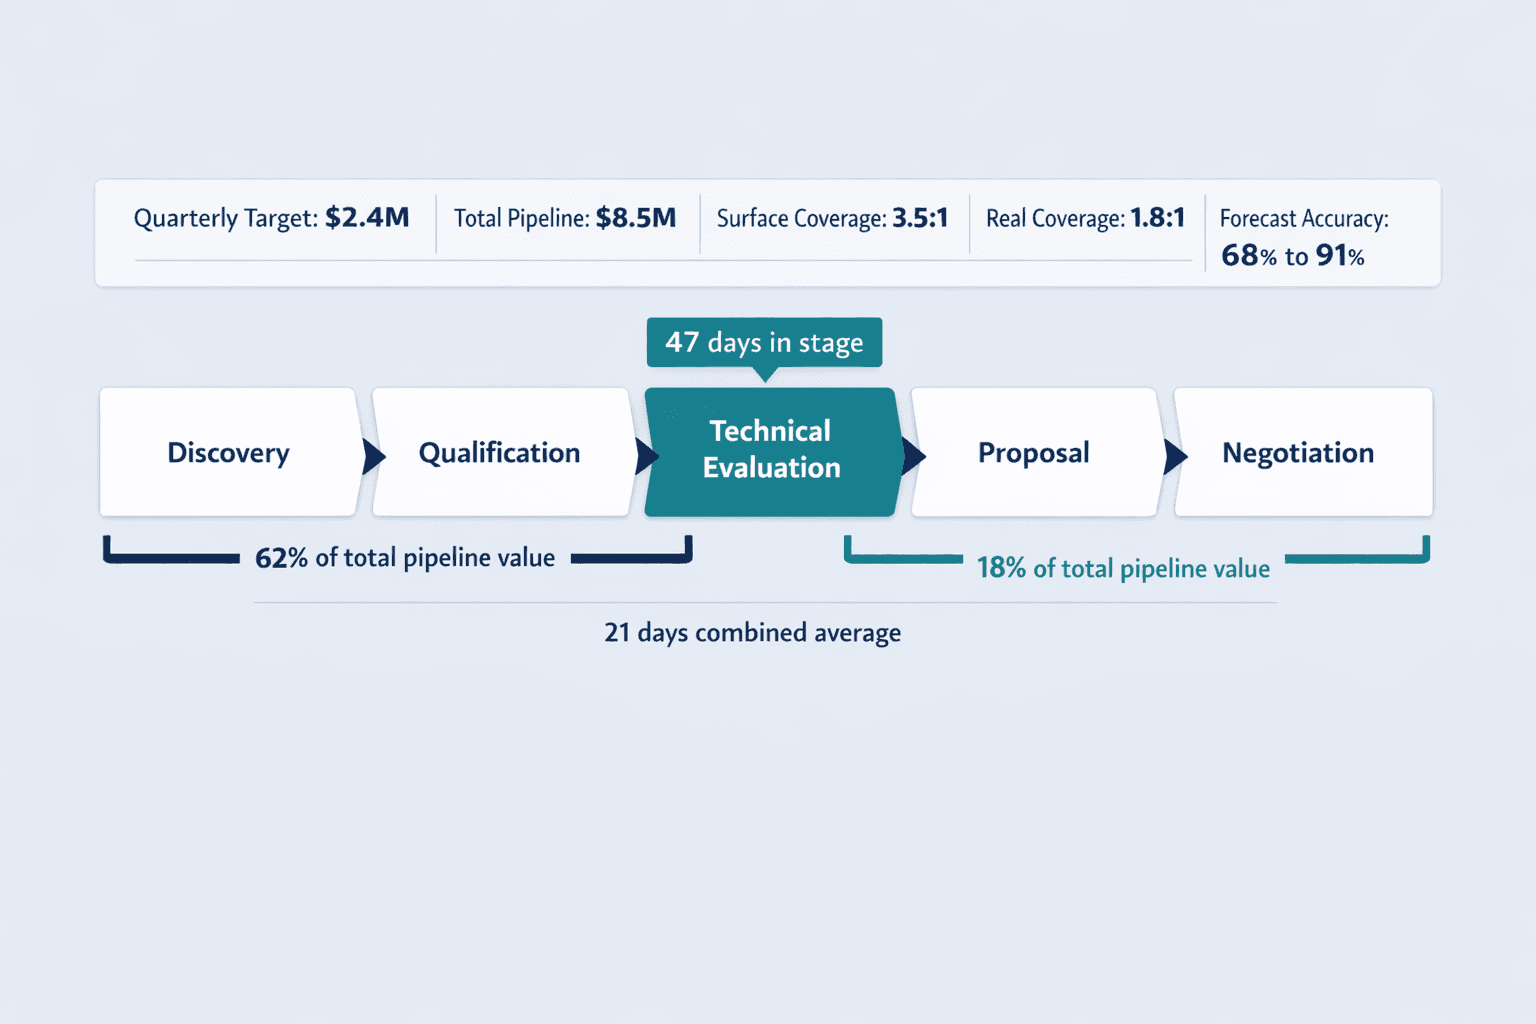
Example: A SaaS company with a $2.4 million quarterly target analyzed their pipeline and found $8.5 million in total opportunity value—a 3.5:1 coverage ratio that looked healthy on the surface. But when they broke down pipeline by stage, 62% of that value sat in early “discovery” and “qualification” stages, while only 18% had reached “proposal” or “negotiation.” Their historical win rate from early stages was 12%, meaning their real pipeline coverage was closer to 1.8:1—well below the 3:1 minimum threshold. They also discovered that deals spent an average of 47 days in the “technical evaluation” stage versus 21 days in every other stage combined—a clear bottleneck. The company accelerated technical evaluations by assigning solution engineers to deals earlier in the cycle and increased top-of-funnel activity by 40% to rebuild early-stage pipeline. Within one quarter, they improved forecast accuracy from 68% to 91%.
Customer Segmentation Analysis
Customer segmentation analysis groups customers by shared characteristics—industry, size, purchase behavior, or value—to tailor sales strategies and identify high-value segments worth prioritizing.
Example: A manufacturing company selling industrial equipment segmented their 850 active customers by annual purchase value, order frequency, and product category mix. They discovered that 12% of customers—mostly in food processing and pharmaceuticals—accounted for 61% of revenue and ordered 4.2 times per year on average. Another 35% of customers placed only one order annually and generated margins 18 percentage points lower due to smaller order sizes and higher fulfillment costs. The company created a tiered account management model: white-glove service and quarterly business reviews for the top 12%, automated touchpoints and self-service ordering for the bottom 35%, and standard coverage for the middle. Sales capacity shifted toward expanding wallet share with top-tier accounts and moving mid-tier accounts upward. Revenue per account in the top tier grew 23% year-over-year, while cost-to-serve in the bottom tier dropped 31%.
AI helps sales teams better understand customer needs and deliver personalized recommendations—but segmentation is the foundation that tells you which customers to prioritize in the first place.
Win/Loss Analysis
Win/loss analysis examines closed deals to understand why opportunities were won or lost. It reveals competitive strengths, common objections, pricing sensitivity, and deal patterns worth replicating.
Example: An enterprise software vendor analyzed 200 closed deals over six months—120 wins and 80 losses. They interviewed buyers, reviewed sales notes, and categorized outcomes by loss reason. The analysis showed that 43% of losses were attributed to price, but deeper examination revealed that “price” often masked other issues. When buyers cited price but chose a competitor, the real issue was typically perceived feature gaps or risk concerns—not absolute cost. Deals lost purely on price were rare (11% of total losses). Meanwhile, 68% of wins came from deals where the champion had used the product in a previous role—a pattern the sales team hadn’t noticed. The company stopped discounting reflexively and instead focused on building champions early in the sales cycle through free trials and reference calls. They also tightened qualification criteria to exit deals earlier when no internal champion existed. Win rate improved from 60% to 71% over the next two quarters.
How to Conduct a Sales Analysis
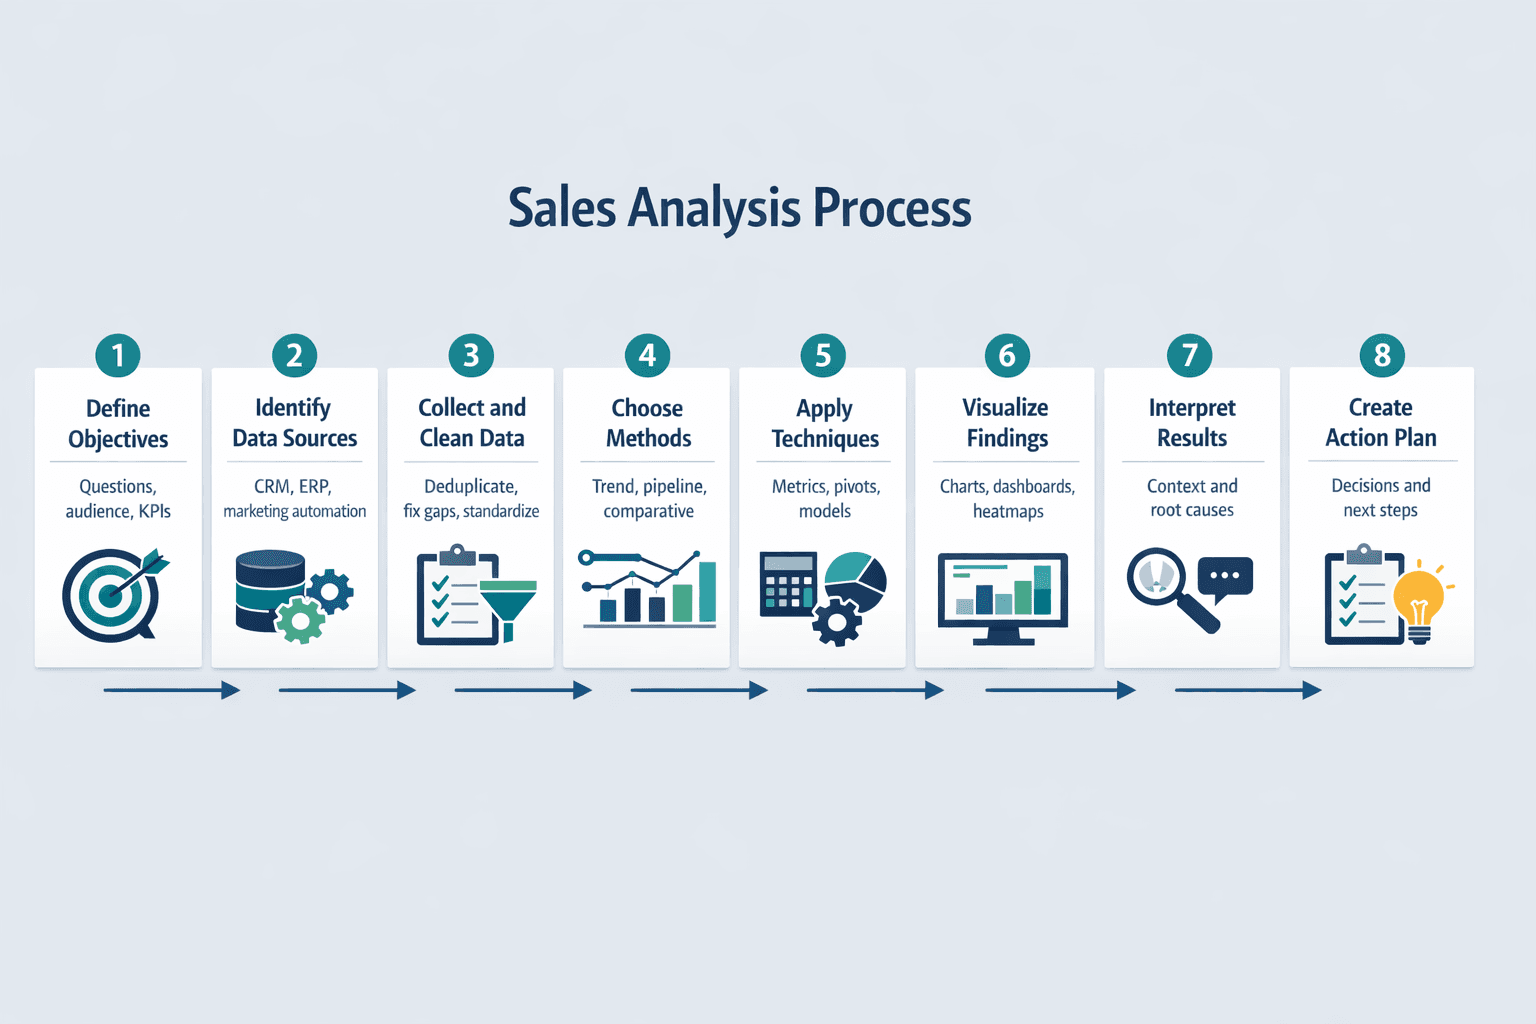
Effective sales analysis follows a structured process. Here’s how to do it:
- Define objectives and questions (15 minutes): Start with what you need to know. Are you forecasting next quarter? Diagnosing a pipeline problem? Comparing territory performance? Identify your audience and the KPIs relevant to them—executives care about forecast accuracy, frontline managers care about rep productivity.
- Identify data sources (10 minutes): Determine where your sales data lives. CRM holds pipeline and activity data. ERP has invoicing and fulfillment data. Marketing automation tracks lead source. Combining CRM pipeline with ERP actuals improves forecast quality versus relying on spreadsheets alone.
- Collect and clean data (1-3 hours): Export or query the data you need. Remove duplicates, fix inconsistencies, and handle missing values. 46% of sales professionals say data quality issues hurt their sales—manual errors, duplicate records, and incomplete data are the top culprits. Cleaning data upfront prevents garbage-in, garbage-out conclusions.
- Choose analysis methods (5 minutes): Match your method to your question. Forecasting? Use pipeline analysis. Diagnosing regional underperformance? Use comparative analysis. Understanding product trends? Use trend analysis by SKU.
- Apply analytical techniques (30 minutes to 2 hours): Run the numbers. Calculate metrics, create pivot tables, build charts, run regression models if needed. Most sales analysis doesn’t require advanced statistics—simple comparisons and trend lines answer 80% of business questions.
- Visualize findings (20 minutes): Create charts, dashboards, or tables that make patterns obvious. A line chart showing MRR growth is clearer than a spreadsheet. A heatmap of territory performance spots outliers faster than a sorted list.
- Interpret results (15 minutes): Ask “so what?” A 15% decline in win rate matters—but is it because lead quality dropped, competitors got stronger, or your pricing changed? Context separates insight from trivia.
- Create action plan (20 minutes): Turn insights into decisions. If pipeline coverage is low, increase prospecting activity. If one territory consistently outperforms, interview that manager and replicate their approach. If deal velocity is slowing, diagnose which stage is the bottleneck and address it.
Sales analysis is iterative. You don’t analyze once and stop—live dashboards and shared KPI views enable ongoing monitoring so you catch problems early and adjust tactics in real time.
FAQ
What Is Product Sales Analysis?
Product sales analysis is the examination of individual product or product category performance to understand what sells, what doesn’t, and why. It looks at revenue by product, units sold, profit margins, sales velocity, customer preferences, seasonal patterns, and product lifecycle stage.
Key aspects of product sales analysis include:
- Revenue by product — Total sales dollars per SKU or category over a given period
- Units sold — Volume moved, useful for inventory planning and vendor negotiations
- Profit margins — Gross margin by product to prioritize high-value offerings
- Sales velocity — How quickly products move from inventory to customer
- Customer preferences — Which segments buy which products, revealing cross-sell opportunities
- Seasonal patterns — Products with predictable demand spikes (holiday goods, seasonal apparel)
- Product lifecycle stage — Whether products are in growth, maturity, or decline phases
Product-level analysis often compares sales, units, gross margin, and variance by category and location to spot underperformers. For example, if the Womens-10 category consistently lags in one district but performs well elsewhere, that signals either a local preference mismatch or an inventory allocation issue.
Product sales analysis informs inventory decisions (which SKUs to stock), pricing strategies (where you have pricing power), and product development (which categories to expand). Inventory turnover ties directly to product sales—low turnover can mean weak demand or deliberate stock build-up ahead of seasonal demand.
What Is Revenue Analysis?
Revenue analysis is the comprehensive examination of all income sources to understand revenue composition, growth patterns, and sustainability. While sales analysis focuses on sales team performance and deal metrics, revenue analysis looks at the bigger picture—total revenue trends, revenue by source or channel, recurring versus one-time income, and revenue per customer.
Components of revenue analysis include:
- Total revenue trends — Overall growth or decline across all income sources over time
- Revenue by source or channel — Direct sales, partner revenue, online sales, subscription revenue, professional services
- Revenue by customer segment — Enterprise, mid-market, SMB, or by industry vertical to identify concentration risk
- Recurring vs. one-time revenue — Recurring revenue from subscriptions versus one-time purchases or setup fees
- Revenue growth rate — Month-over-month or year-over-year percentage change
- Revenue per customer or employee — Efficiency metrics that guide hiring and expansion decisions
The distinction matters: revenue analysis includes all income such as one-time fees, hardware sales, setup charges, and recurring subscriptions. Sales analysis narrows in on the sales function specifically—pipeline health, quota attainment, win rates, and rep productivity.
For example, MRR measures predictable recurring income monthly and differs from total revenue because total revenue also includes non-recurring sources. Businesses monitor recurring revenue separately to understand growth, contraction, and stability independently from one-time windfalls or project-based income.
Revenue analysis answers questions like: Is our revenue diversified or concentrated in one customer segment? Are we growing sustainably through recurring income or dependent on constantly closing new one-time deals? Which channels produce the highest margin revenue?