Sales Report: What It Is, Templates and Examples
A sales report tracks revenue, metrics, and performance over time. This guide covers daily, monthly, and annual reports—what to include, how to build Excel templates, and examples you can adapt.
Quick Verdict
A sales report is a document that tracks sales performance, revenue, and key metrics over a specific time period—whether that’s a day, week, month, or year. It shows what’s selling, who’s selling it, and how well you’re hitting your goals.
Sales reports matter because they turn raw transaction data into actionable insights. They help you identify trends before they become problems, measure team performance against quotas, and forecast future revenue more accurately. Without regular sales reporting, you’re flying blind—reacting to issues instead of preventing them.
This guide covers everything you need to create effective sales reports: the different types (daily, monthly, annual), what metrics to track, how to build templates in Excel, and real-world examples you can adapt for your business.
What Is a Sales Report
A sales report is a structured document that captures sales data, metrics, and performance indicators for a specific period. It’s how you track what’s working, what’s not, and where your revenue actually comes from.
Every sales report typically includes:
- Revenue figures — Total sales for the period and how that compares to previous periods
- Units sold — Quantity of products or services sold, often broken down by category
- Sales by product or service — Which offerings are performing best and which are underperforming
- Sales by team member — Individual performance metrics to track quota attainment and identify top performers
- Conversion rates — How many leads or opportunities turned into closed deals
- Time period coverage — Clear date ranges so you can compare apples to apples across reports
Sales reports differ from other business documents because they focus specifically on sales-specific metrics and performance tracking. While a P&L statement shows overall profitability, a sales report drills into the mechanics of revenue generation—separating segments like online sales versus face-to-face sales to reveal which channels actually drive growth.
Purpose and Benefits
Sales reports serve several core purposes:
- Performance tracking — Monitor quota attainment to see who’s on track and who needs support
- Identifying trends — Spot patterns in product demand, seasonal fluctuations, or emerging customer preferences
- Accountability — Create visibility into individual and team results so everyone knows where they stand
- Forecasting — Use historical data to predict future revenue and set achievable goals
- Strategic planning — Make informed decisions about hiring, inventory, pricing, and resource allocation based on what the numbers actually show
Different stakeholders use sales reports differently. Sales managers rely on them to coach reps and adjust tactics mid-period. Executives use them to evaluate overall business health and decide where to invest. Team members track their own performance to see if they’re on pace to hit their targets—and their commissions.
Daily Sales Report
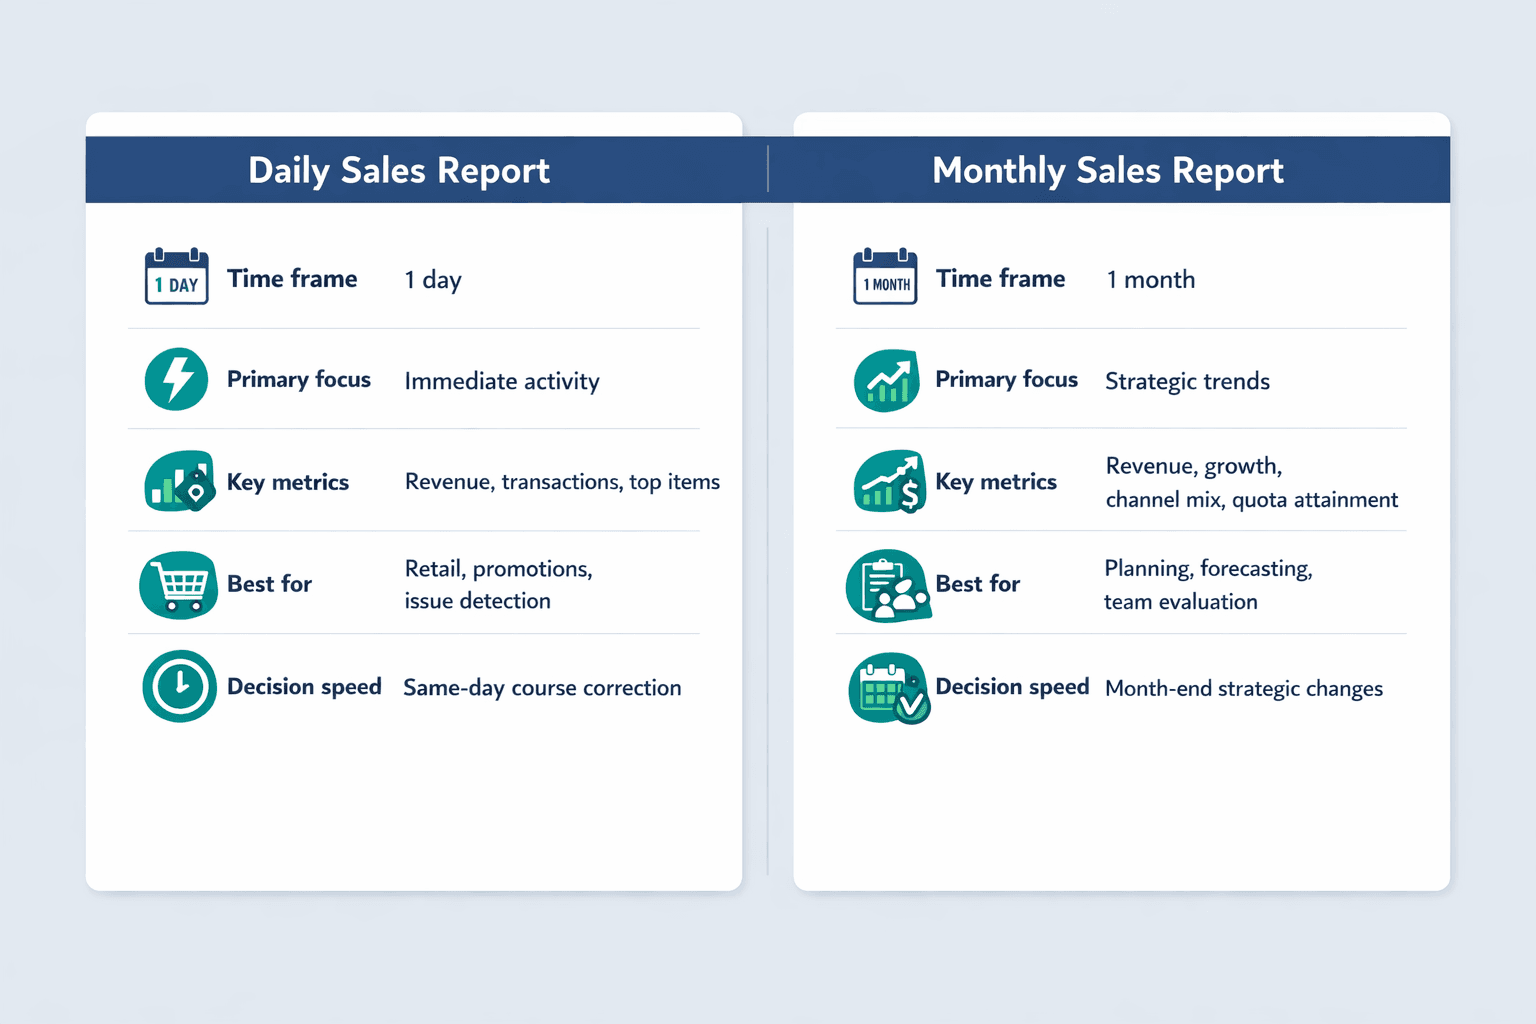
A daily sales report captures each day’s sales activity in a short-term tracking document. It’s your real-time pulse check on what happened today—revenue, transactions, and top-performing items.
Key metrics tracked in daily reports:
- Total revenue — How much money came in today
- Number of transactions — How many sales were completed
- Average transaction value — Total revenue divided by number of transactions
- Sales by product category — Which product groups moved today
- Top performing items — Your best sellers for the day
When to Use Daily Sales Reports
Daily reports are essential in specific business scenarios:
- Retail businesses — Track same-day sales to identify stockouts, theft, or register discrepancies before they compound
- High-volume sales teams — Monitor rep activity levels—calls made, proposals sent, opportunities created—to catch performance drops early
- Tracking promotional campaigns — See if today’s email blast or discount code actually drove sales
- Identifying immediate issues — Catch problems like payment processing failures or inventory errors while they’re fresh
Daily reports help with quick course correction and immediate decision-making. If you notice sales dropped 40% on Tuesday with no obvious reason, you can investigate and fix it Wednesday morning—not three weeks later when you finally review the monthly report. Daily reporting increases rep accountability and productivity because everyone knows their numbers will be visible by end-of-day.
Monthly Sales Report
A monthly sales report is a comprehensive document that analyzes sales performance over a full month. It’s where you step back from daily noise and look for patterns, trends, and strategic insights.
Key metrics tracked in monthly reports:
- Total monthly revenue — Your top-line sales figure for the period
- Month-over-month growth — Percentage change from last month to see momentum
- Sales by channel — Revenue split across online, in-store, phone, partner, etc.
- Customer acquisition numbers — How many new customers you added this month
- Average deal size — Mean revenue per closed deal
- Sales cycle length — Average days from first contact to closed sale
- Quota attainment — Percentage of goal achieved, team-wide and by individual
Components of a Monthly Sales Report
Standard sections included in monthly reports:
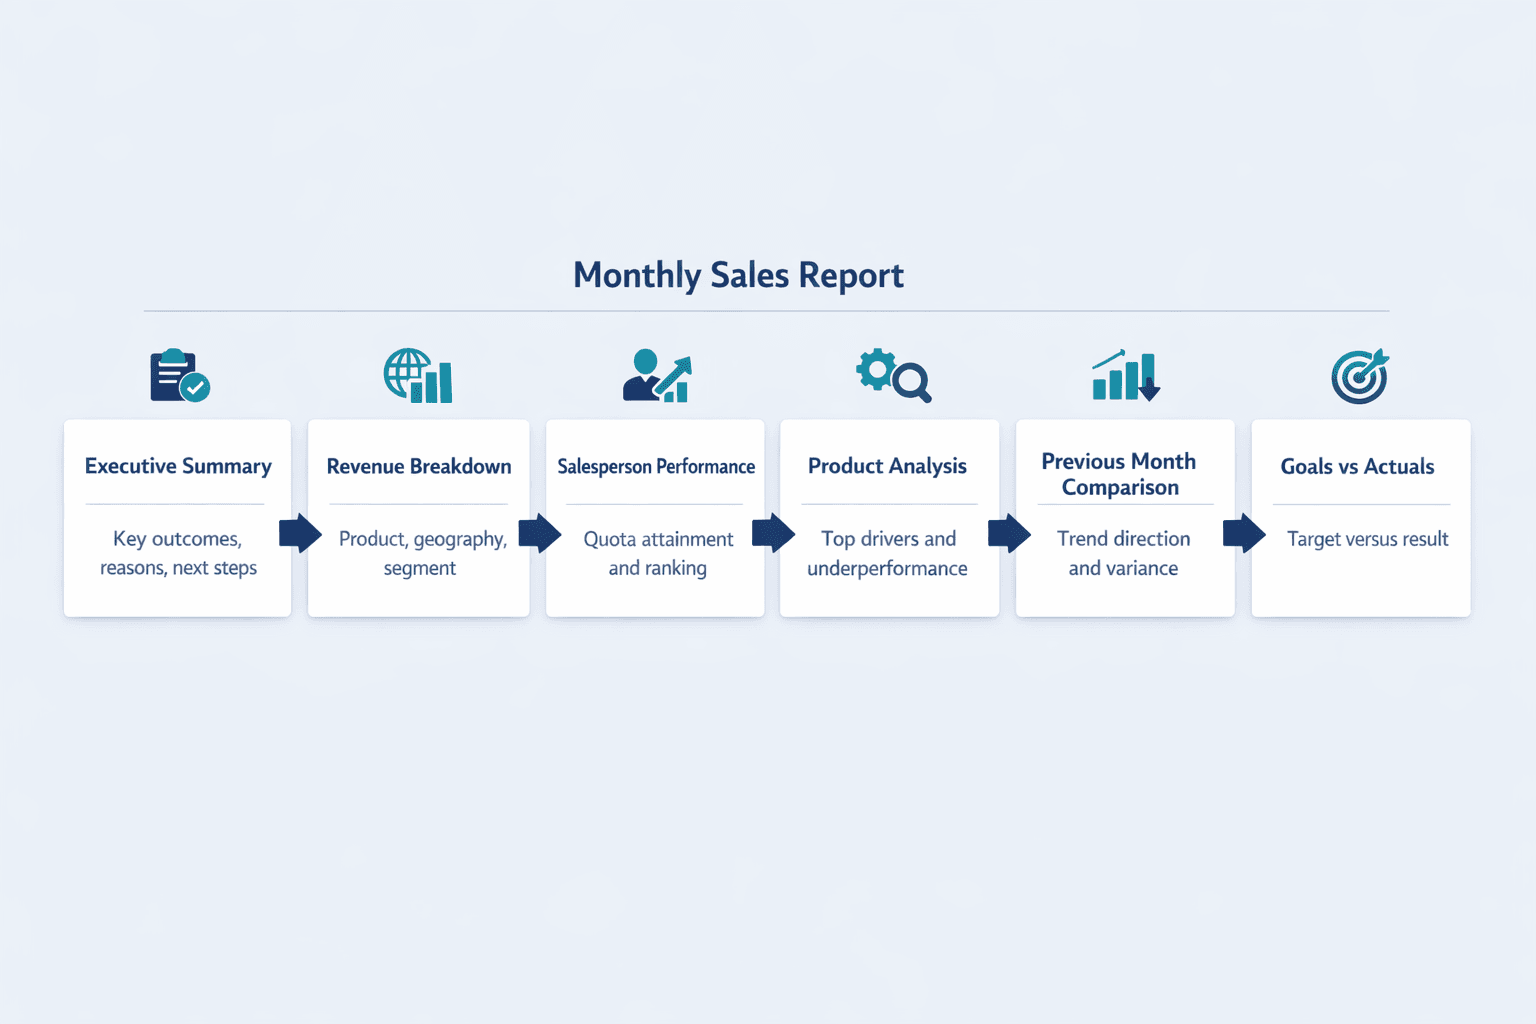
- Executive summary — High-level takeaways in 2-3 sentences—what happened, why it matters, what’s next
- Revenue breakdown — Total sales split by product line, geography, or customer segment
- Performance by salesperson or team — Individual results against quota, ranked or grouped by achievement level
- Product or service performance analysis — Which offerings drove revenue, which underperformed, and why
- Comparison to previous months — Side-by-side or trend-line view showing if you’re improving or declining
- Goals vs. actuals — Visual comparison of planned targets versus actual results
Monthly reports provide strategic insights for planning and forecasting. They help determine whether your sales strategy is effective enough to keep or needs changes—unlike daily reports, which focus on tactics and execution, monthly reports reveal whether your overall approach is working.
Sales Report Template
A sales report template is a pre-formatted document structure that standardizes your sales reporting. Instead of building each report from scratch, you fill in data fields and let formulas calculate the rest.
Benefits of using templates:
- Saves time — No need to recreate headers, formulas, and layouts every reporting period
- Ensures consistency — Everyone reports the same metrics in the same format
- Reduces errors — Pre-built formulas eliminate manual calculation mistakes
- Makes data comparable across periods — Standardized structure lets you spot trends easily
- Easier training for team members — New hires follow the same template everyone else uses
Essential Elements of a Sales Report Template
Must-have sections in any sales report template:
- Header with time period and report type — “Daily Sales Report — March 15, 2025” or “Monthly Sales Report — Q1 2025”
- Revenue summary section — Total sales, prior period comparison, variance percentage
- Sales breakdown by category — Product lines, regions, channels, or customer segments
- Performance metrics table — Key KPIs like conversion rate, average deal size, quota attainment
- Comparison charts — Visual representation of trends over time or versus targets
- Notes or observations section — Space for context—what drove the numbers, what changed, what to watch
- Action items or recommendations — Next steps based on the data—what to fix, what to double down on
Types of Sales Report Templates
Common template variations:
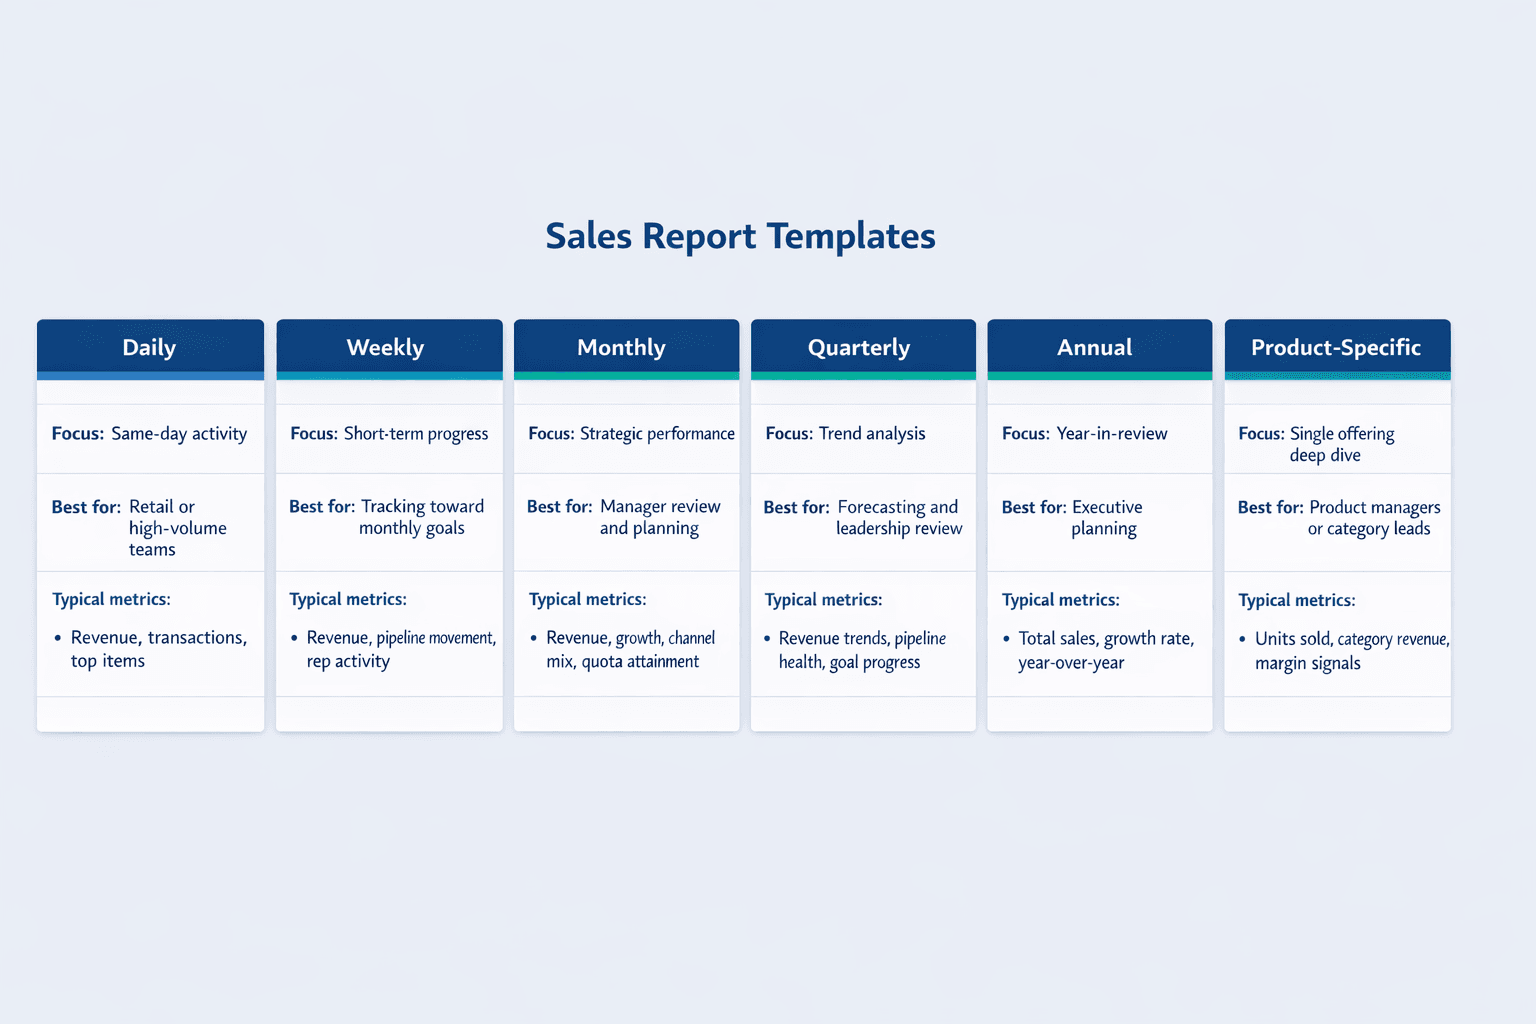
- Daily sales template — Focuses on transaction-level details and same-day performance
- Weekly sales template — Aggregates daily results and tracks short-term progress toward monthly goals
- Monthly sales template — Comprehensive view with strategic metrics and month-over-month comparisons
- Quarterly sales template — Higher-level analysis with trend data and longer-term forecasting
- Annual sales template — Year-in-review with full-year totals, growth rates, and year-over-year benchmarks
- Product-specific sales template — Deep dive into a single product line or service category
Choose the right template type based on how often you need to report and what decisions those reports will drive. If you’re managing a retail store, daily and weekly templates matter most. If you’re a B2B sales manager, monthly and quarterly templates provide the strategic view you need to coach your team and adjust tactics.
Sales Report Template Excel
Excel is commonly used for sales report templates because of its built-in formulas, chart capabilities, accessibility (most businesses already have it), and customization options—you can tailor templates to your exact needs without buying specialized software.
Key Excel Features for Sales Reports
Excel functions useful for sales reporting:
- SUM and AVERAGE formulas — Calculate totals and means automatically as new data is entered
- Pivot tables — Summarize and analyze large datasets to reveal patterns and trends
- Conditional formatting — Highlight top performers in green, underperformers in red, or flag anomalies automatically
- Charts and graphs — Visual representation of sales trends, comparisons, and goal progress
- Data validation — Restrict data entry to specific formats (dates, numbers, dropdown selections) to prevent errors
- VLOOKUP for data matching — Pull in product names, pricing, or customer details from master lists automatically
Creating a Basic Excel Sales Report Template
Here’s how to build a simple Excel sales report:
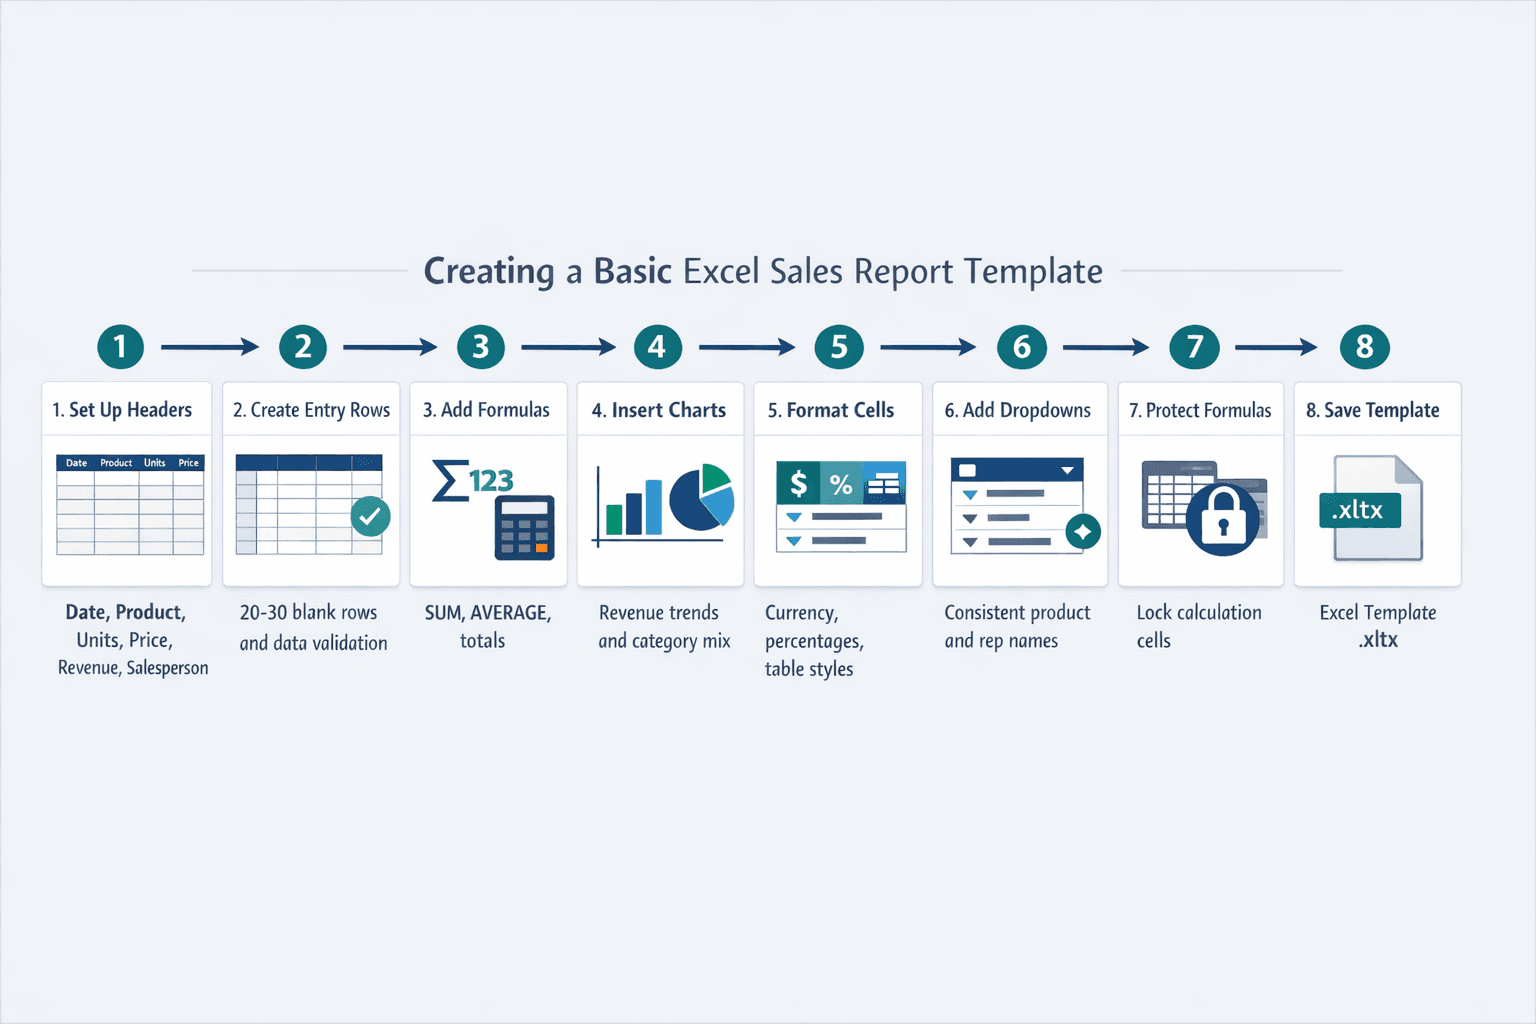
- Set up column headers (5 minutes): Create columns for Date, Product/Service, Units Sold, Unit Price, Total Revenue, Salesperson, and any other metrics you track regularly. Organize data in columns with a single header row so Excel can process it properly.
- Create data entry rows: Leave 20-30 blank rows below headers for daily entries. Use data validation on key columns—set the “Product” column to a dropdown list of your actual products, set “Date” to only accept date formats.
- Add formula calculations for totals (10 minutes): Below your data entry rows, create summary cells: Total Revenue (=SUM of Revenue column), Average Transaction Value (=AVERAGE of Revenue column), Units Sold (=SUM of Units column). These update automatically as you enter new sales.
- Insert charts for visualization: Select your data range and insert a column chart for daily revenue trends or a pie chart for sales by product category. Charts update automatically as source data changes.
- Format cells and tables (5 minutes): Apply currency formatting to revenue columns, percentage formatting to variance calculations, and use Excel’s table styles to make the report scannable. Add borders and shading to separate sections.
- Add dropdown menus for categories: Create dropdown lists for Product, Salesperson, and any other repeating fields. This ensures consistency—everyone enters “Widget A” the same way every time.
- Protect formula cells: Lock cells containing formulas so team members can enter sales data without accidentally breaking calculations. Leave data entry cells unlocked.
- Save as template: Go to File > Save As, choose “Excel Template (.xltx)” as the file type. Now you can open a fresh copy each reporting period without overwriting your master template.
Benefits of Excel templates versus other reporting tools: Excel gives you flexibility to customize exactly how you want, there’s no additional software cost beyond what you’re already paying for Microsoft 365, and most people already know how to use it—no training required.
Sales Report FAQs
What Is a Sales Report Example?
A sales report example shows what real sales reporting looks like in practice. Here are three common scenarios:
A retail daily sales report might show transactions and revenue by hour—8am-9am: 12 transactions, $847; 9am-10am: 18 transactions, $1,203—along with payment method breakdown, top-selling items, and total daily revenue. This helps store managers identify peak traffic times and adjust staffing.
A B2B monthly sales report tracks deal pipeline and closings: 45 opportunities created, 12 moved to proposal stage, 7 closed-won for $143,000 total revenue, 3 closed-lost. It includes top customers by revenue share, average sales per customer, and comparison to last month’s results—all focused on account-level analysis and rep performance against quota.
An e-commerce weekly sales report analyzes product performance: 342 orders placed, $28,450 in revenue, top product category (Electronics: 38% of sales), average order value $83.19, conversion rate 2.4%. Charts show daily revenue trends and week-over-week growth.
Sales report examples commonly show:
- Actual data tables with numbers — Not just descriptions, but real figures formatted clearly
- Visual charts or graphs — Bar charts for daily trends, pie charts for category breakdowns, line graphs for month-over-month comparisons
- Summary statistics — Totals, averages, percentages, and variance calculations
- Comparative analysis to previous periods — This week vs. last week, this month vs. same month last year
How Do You Create a Sales Report for Small Business?
Small businesses should start with basic metrics, use simple templates, and focus on actionable insights—you don’t need enterprise-level complexity to get value from sales reporting.
Here’s the simple approach for small business sales reporting:
- Identify key metrics to track (15 minutes): Start with total revenue, number of transactions, and top-selling products. Segment sales data if you sell through multiple channels (online vs. in-person) to see which actually drives growth.
- Choose reporting frequency: Weekly or monthly is recommended for most small businesses. Daily reporting is only worth it if you’re retail or high-volume—otherwise you’re spending time on reports instead of making sales.
- Select a template or create simple spreadsheet (30 minutes): Download a free Excel template or build your own using the steps in the “Creating a Basic Excel Sales Report Template” section above. Keep it minimal—5-10 key metrics max.
- Collect sales data from POS or CRM: Export transaction data from your point-of-sale system, Shopify, Square, or whatever you use to process payments. If you don’t have a system, manually track sales in a spreadsheet daily—it’s tedious but necessary.
- Calculate totals and averages (10 minutes): Use SUM formulas for total revenue and units sold. Use AVERAGE formulas for transaction value. If you track average order value, monitor whether it’s improving over time—that matters more than any single week’s number.
- Compare to goals or previous periods: Pull last month’s or last year’s numbers and calculate percentage change. Even a simple “up 12% from last month” tells you if you’re moving in the right direction.
- Review and take action on findings (20 minutes): Don’t just record numbers—ask what they mean. If sales dropped 20%, why? Fewer customers, lower transaction values, or both? What can you do differently next week? Focus on trends, not isolated figures.
Tips for small businesses:
- Start simple and add complexity as needed — Track 5 metrics well instead of 20 metrics poorly
- Automate data collection where possible — Use POS or e-commerce platform reporting instead of manual entry
- Focus on trends not just numbers — One bad week doesn’t matter; three straight weeks of decline does
- Make reporting a regular habit — Block 30 minutes every Monday morning to review last week’s numbers and plan this week’s actions