SEO KPI Report: Metrics That Actually Matter
Most SEO reports track vanity metrics that don't drive decisions. This guide shows you which KPIs actually matter—revenue attribution, AI Overview visibility, engagement depth—and how to build reports that prove ROI.
Quick Verdict
Most SEO KPI reports track the wrong metrics. They’re packed with keyword rankings, total organic traffic, and domain authority scores—numbers that look impressive in a deck but rarely drive actual business decisions.
The shift from vanity metrics to business impact metrics accelerated in 2026. Google’s Organic Search definition now includes AI Overviews and AI Mode, meaning visibility extends far beyond blue-link rankings. The old playbook of tracking positions 1-10 no longer captures how users actually find and engage with your content.
This guide shows you which metrics to track, which to ignore, and how to build a report that demonstrates ROI. You’ll learn how to align SEO measurement with business goals, automate data collection, and turn raw numbers into strategic recommendations that stakeholders actually act on.
What Is an SEO KPI Report?
An SEO KPI report is a document that tracks specific measurable outcomes from your SEO efforts—revenue, visibility, conversions, and technical health—tied directly to business goals.
It’s not a general analytics dashboard. A dashboard shows you everything; a KPI report shows you what matters. The difference is focus: instead of dumping every available metric into a spreadsheet, you curate 10-12 indicators that actually influence decisions—budget allocation, content strategy, technical priorities.
Key characteristics of a true KPI report:
- Aligned with business objectives — Every metric connects to a goal stakeholders care about (revenue, leads, market share)
- Regular cadence — Monthly executive updates, weekly campaign tracking, or daily technical monitoring—chosen to match metric volatility and audience needs
- Actionable insights — Each underperforming metric triggers a specific recommendation with priority and owner
- Trend tracking — Always includes historical context—month-over-month, year-over-year, or progress toward quarterly targets
- Context and annotations — Raw numbers get explanations: algorithm updates, site changes, seasonal patterns
The Purpose of Tracking SEO KPIs
Businesses track SEO KPIs to prove value, identify problems before they become crises, and guide strategic pivots. Without measurement, you’re flying blind—no way to justify budget, no early warning when visibility drops, no data to support resource allocation.
Good KPI tracking enables:
- Budget justification — Show organic revenue attribution and compare customer acquisition cost to paid channels
- Resource allocation — Prioritize technical fixes, content updates, or link building based on actual performance gaps
- Strategic pivots — Spot AI Overview citation opportunities or zero-click trends early enough to adjust content strategy
- Stakeholder communication — Translate SEO outcomes into business language executives understand—pipeline contribution, market share, conversion efficiency
SEO Metrics That Actually Matter in 2026
The shift from traditional ranking metrics to AI citation and zero-click metrics is complete. Tracking keyword positions alone misses the reality: users find your brand in AI Overviews, featured snippets, and Discover feeds—often without ever clicking. Modern SEO measurement reflects that.
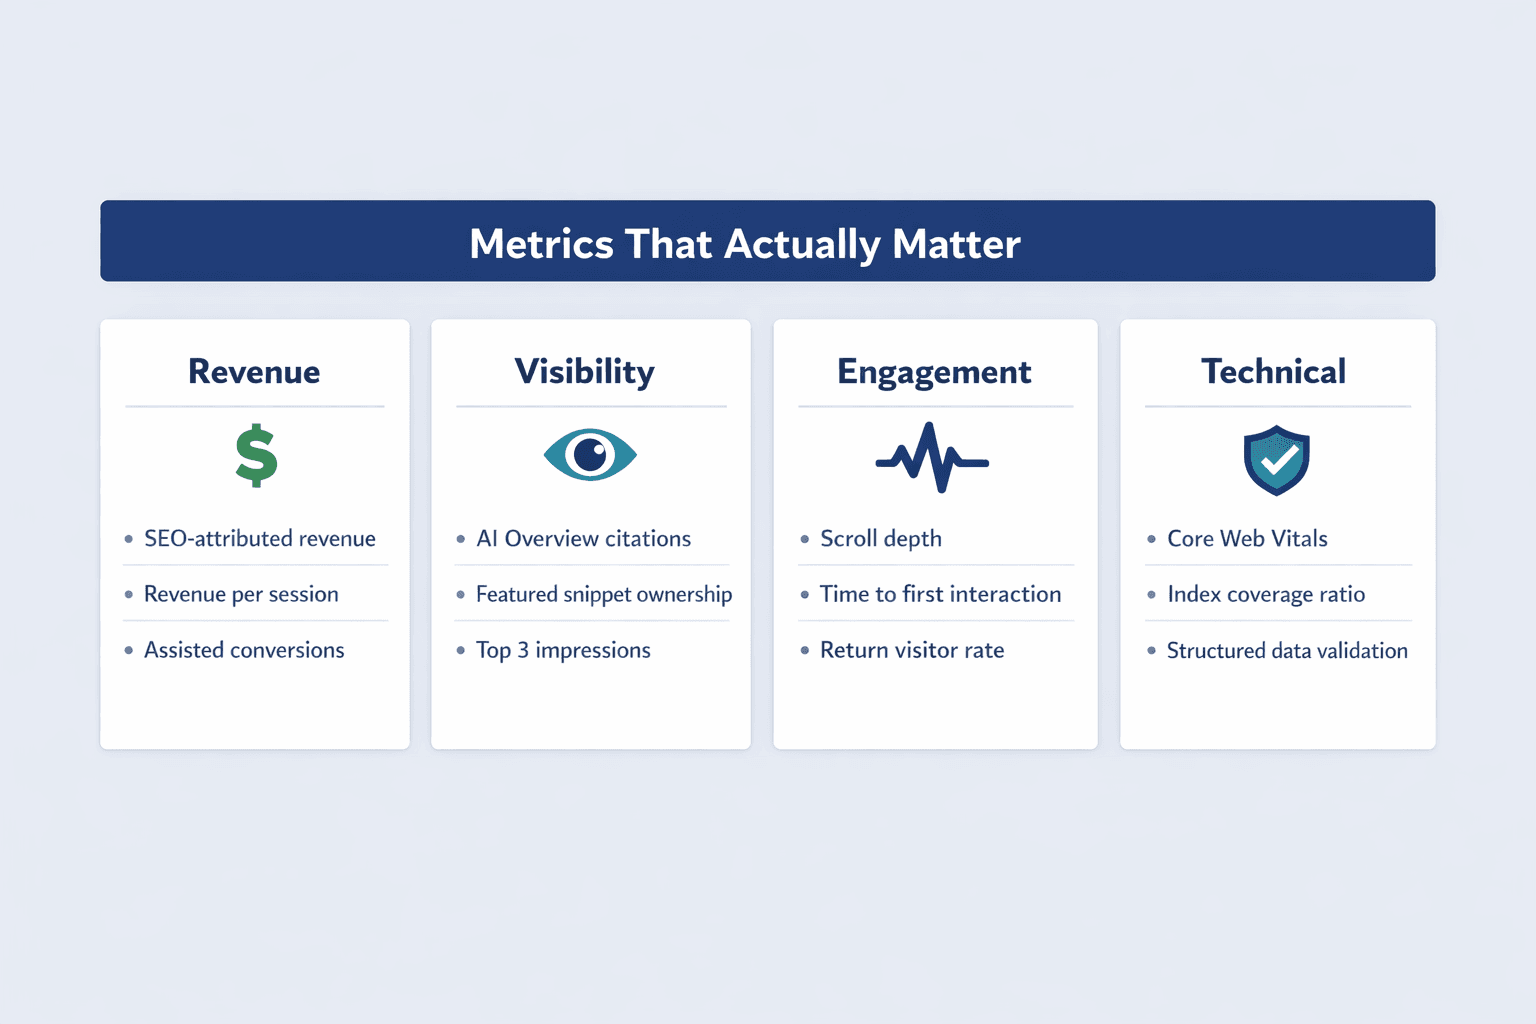
Revenue-Driven Metrics
Revenue attribution is the ultimate SEO KPI. If you can’t tie organic traffic to dollars, you can’t prove SEO works.
Track these revenue metrics:
- SEO-attributed revenue — Use GA4’s channel grouping to isolate conversions and revenue from Organic Search at event, session, and user scope
- Revenue per session — Divide total organic revenue by organic sessions to measure value density
- Assisted conversions — Track multi-touch attribution where organic played a role but wasn’t the last click
- Customer acquisition cost from organic — Calculate cost per organic customer (SEO investment ÷ new customers from organic) and compare to paid CAC
- Lifetime value of organic traffic — Segment organic users by cohort and measure long-term revenue contribution
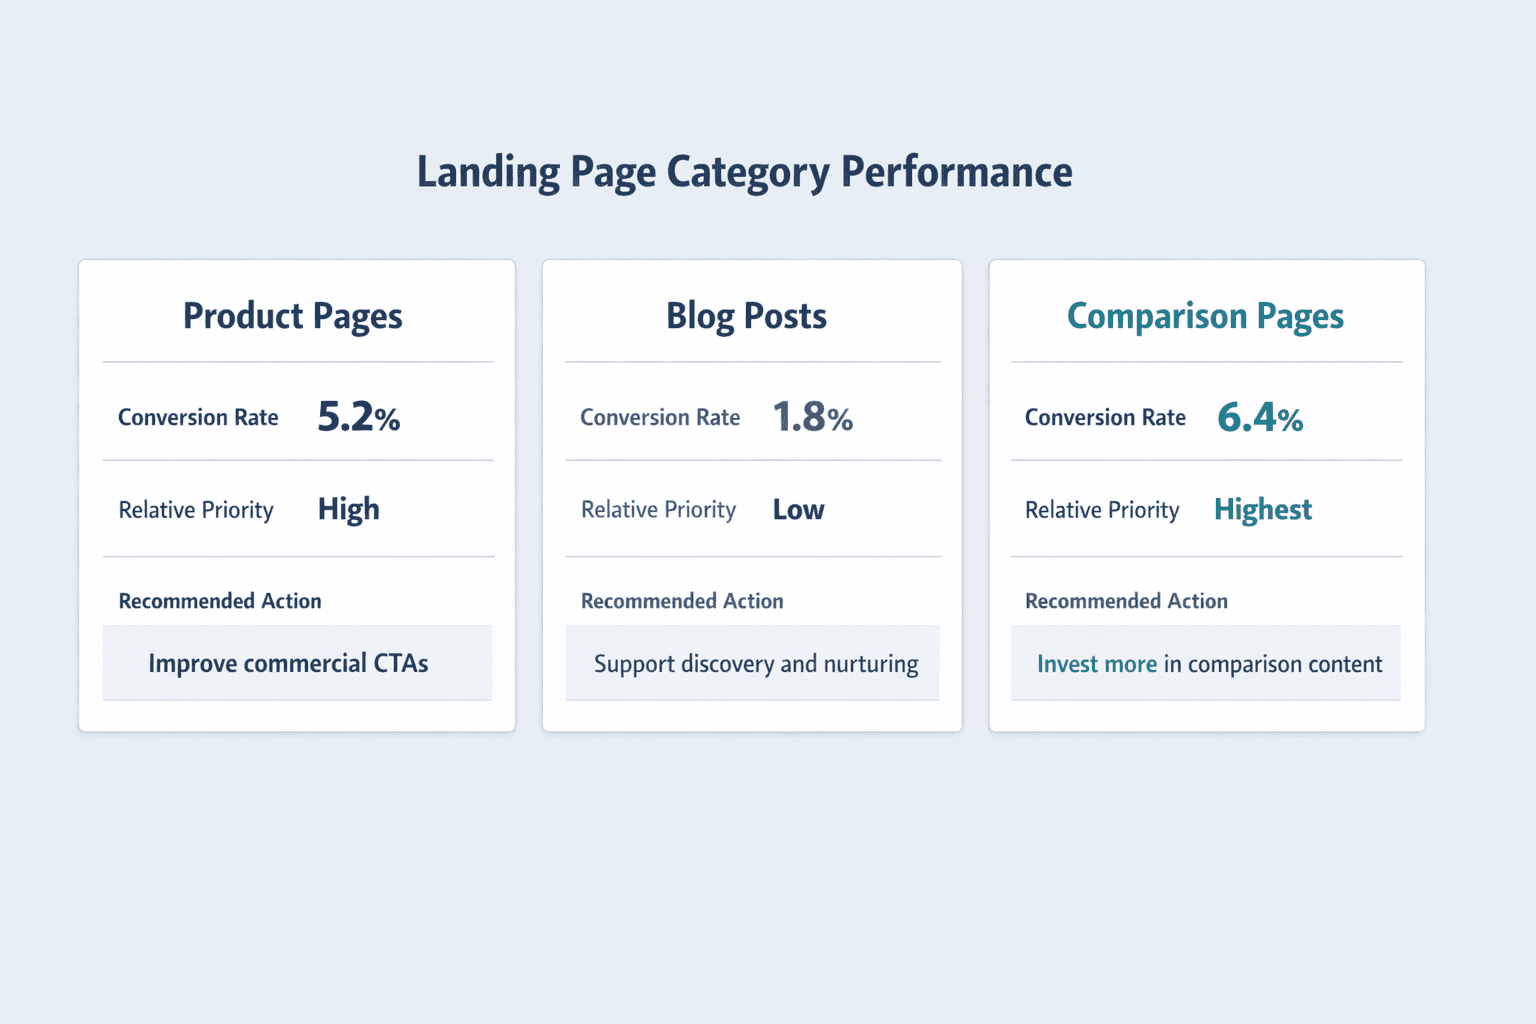
- Conversion rate by landing page category — Identify which page types (product, comparison, how-to) convert best
Visibility Metrics Beyond Rankings
Visibility has changed. AI Overviews surface answers without clicks. Featured snippets own position zero. Traditional rankings still matter, but they’re one piece of a bigger picture.
Modern visibility metrics to track:
- AI Overview citations — Monitor how often your content appears in AI-generated summaries (requires external tooling as of mid-2026)
- Featured snippet ownership — Track featured snippet capture rate for target queries—featured snippets typically occupy position 1
- Impressions in top 3 positions — Filter Search Console performance data to see impression volume for queries where you rank 1-3
- Share of voice — Calculate your impression share vs competitors for core keyword sets
- Branded vs non-branded visibility split — Measure how much visibility depends on brand recognition vs discovery searches
Engagement Quality Metrics
Engagement depth matters more than pageviews. A visitor who scrolls 75%, interacts with CTAs, and returns later is worth ten who bounce in five seconds.
Track these engagement quality metrics:
- Scroll depth percentage — Measure how far users scroll on key landing pages—correlates strongly with conversion intent
- Time to first interaction — Track seconds until first click, form fill, or CTA engagement
- Pages per session for target segments — Filter GA4 to measure session depth for organic users landing on priority pages
- Return visitor rate — Higher return rates suggest content quality and brand recall
- Bounce rate for target landing pages — Identify high-intent pages with engagement problems
Technical Health Indicators
Technical SEO issues kill visibility before users ever see your content. Core Web Vitals, indexing errors, and crawl inefficiency all impact performance.
Track these technical metrics:
- Core Web Vitals scores — Monitor LCP, INP, and CLS at the 75th percentile—“good” thresholds are LCP ≤ 2.5s, INP ≤ 200ms, CLS ≤ 0.1
- Crawl budget efficiency — For large sites, track crawl rate vs valuable URLs discovered
- Index coverage ratio — Divide indexed pages by total known pages to measure indexing health
- Mobile usability errors — Monitor mobile usability issues flagged in Search Console
- Structured data validation rate — Track valid vs invalid structured data items detected by Google
Metrics to Stop Tracking (Vanity Metrics)
Certain popular metrics don’t drive decisions. They look good in reports but rarely change what you do next week.
| Vanity Metric | Why It Misleads | Track This Instead |
|---|---|---|
| Total organic traffic | Doesn’t distinguish high-intent from low-value visits | Organic traffic to conversion-focused landing pages + conversion rate |
| Keyword rankings without intent context | Position 3 for a query with zero purchase intent is useless | Impressions and clicks for queries with proven conversion correlation |
| Domain authority | Third-party metric with no direct business impact | Index coverage ratio, backlinks to revenue-driving pages, competitive visibility trends |
| Total backlinks | Quantity without quality means nothing | Backlinks from high-traffic referrers, backlinks to conversion pages, referring domain growth from target industries |
| Generic pageviews | Doesn’t differentiate engaged users from accidental visitors | Scroll depth, time to first interaction, return visitor rate |
How to Build an SEO KPI Report
Building a KPI report starts with goal-setting, not metric selection. You align measurement with business objectives, choose reporting frequency based on audience needs, visualize for clarity, automate for consistency, and add context so numbers drive action.
Step 1: Align Metrics with Business Goals
Start with what the business needs to achieve, not with what Google Analytics can measure. If leadership cares about pipeline contribution, track organic leads and their close rates. If the goal is market share expansion, measure visibility against competitors.
Questions to ask stakeholders:
- What defines success for the business this quarter? (Revenue targets, user growth, geographic expansion?)
- What actions should SEO drive? (Signups, purchases, demo requests, content engagement?)
- What KPIs do other departments track? (Marketing tracks CAC and LTV; sales tracks pipeline contribution—SEO should speak that language)
- What numbers influence budget decisions? (If CFO approves based on ROI, lead with revenue attribution and cost efficiency)
Step 2: Choose Your Reporting Frequency
Match reporting cadence to metric volatility and audience needs. Technical issues need daily monitoring. Executive updates work monthly. Campaign performance reviews fit weekly rhythms.
Reporting frequencies and use cases:
- Daily — Technical monitoring (index coverage drops, Core Web Vitals degradation, crawl errors)—hourly Search Console data enables near-real-time anomaly detection
- Weekly — Campaign tracking (new content performance, seasonal landing page visibility, paid/organic coordination)
- Monthly — Executive updates (revenue attribution, market share trends, strategic progress toward quarterly goals)—GA4 scheduled reports automate monthly distribution
- Quarterly — Strategic reviews (competitive positioning, multi-channel attribution, long-term trend analysis)
Step 3: Select Visualization Methods
Presentation format affects whether insights get acted on. Trend lines show progress. Comparison tables reveal competitive gaps. Heat maps surface page-level problems. Goal progress bars give executives a single glance at success.
Visualization best practices:
- Trend lines for progress metrics — Show revenue, impressions, and conversions over 3-6 months with annotations for algorithm updates or site changes
- Comparison tables for competitive analysis — Side-by-side share of voice, featured snippet ownership, and visibility trends vs top 3 competitors
- Heat maps for page-level performance — Color-code landing pages by conversion rate and engagement depth to identify optimization priorities
- Goal progress bars for executive summaries — One-number headline metrics (quarterly organic revenue target, market share goal) with visual progress indicators
- Annotations for major events/changes — Always mark algorithm updates, site migrations, campaign launches, and seasonal peaks on trend charts
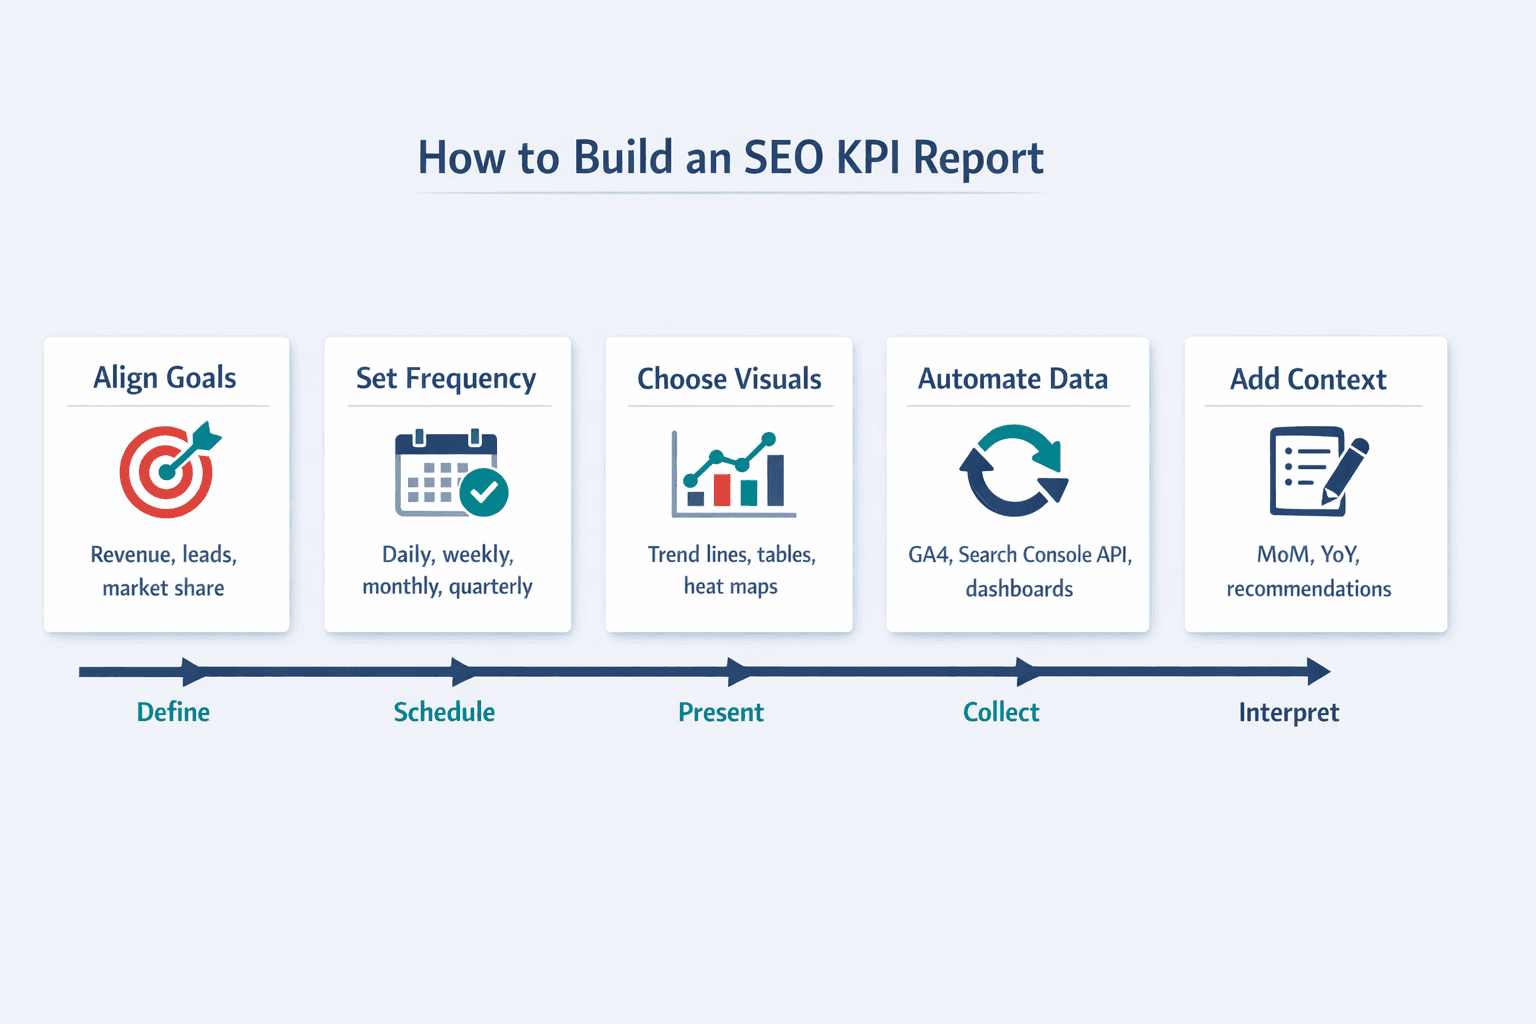
Step 4: Automate Data Collection
Automation ensures consistency and saves hours every reporting cycle. Manual exports introduce errors and delay insights.
Automation approaches:
- Google Analytics 4 custom reports — Build custom reports in GA4 and schedule email delivery to stakeholders
- Google Search Console API connections — Use the Search Console API to pull clicks, impressions, and position data into dashboards or spreadsheets programmatically
- SEO platform integrations — Connect Ahrefs, SEMrush, or Moz to pull backlink, rank tracking, and competitive data into your reporting stack
- Data Studio/Looker Studio dashboards — Looker Studio connectors for Analytics and Search Console enable blended, auto-updating dashboards
- Scheduled exports to spreadsheets — For smaller teams, set up automated CSV exports from GA4 and Search Console to a shared Google Sheet on a recurring schedule
Step 5: Add Context and Recommendations
Raw numbers need interpretation. A 15% drop in impressions means nothing without context: Was there an algorithm update? Did we deindex a category? Is this seasonal?
Types of context to include:
- Month-over-month and year-over-year comparisons — Search Console supports date comparisons natively—always show MoM and YoY change percentages
- Annotations for algorithm updates or site changes — Mark Google core updates, site migrations, redesigns, and campaign launches directly on trend charts
- Variance explanations for unexpected changes — If Core Web Vitals scores drop suddenly, include a bullet: “LCP degraded due to unoptimized hero images added in March site refresh—fix in progress”
- Specific next-step recommendations tied to each metric — Every underperforming metric gets one clear recommendation: “Index coverage ratio dropped 8% due to orphaned blog posts—run internal link audit by end of month”
SEO KPI Report Template
This template structure covers executive summaries, core metric dashboards, segment breakdowns, competitive context, and forward-looking recommendations. Adapt sections based on your business model and stakeholder needs.
Executive Summary Section
The executive summary is designed for stakeholders who won’t read the full report. It surfaces wins, flags problems, and provides one strategic recommendation—all in five bullets or less.
Elements to include:
- Top 3 wins with business impact — “Organic revenue up 22% MoM driven by product comparison content ranking in AI Overviews”
- Top 2-3 concerns requiring action — “Mobile usability errors affecting 18% of product pages; index coverage dropped 12% due to sitemap misconfiguration”
- Single-number headline metric — Revenue, conversions, or market share—whatever the C-suite cares about most
- Progress toward quarterly goals — “68% toward Q2 organic lead target; on track to exceed by month-end”
- One-sentence strategic recommendation — “Prioritize AI Overview optimization for high-intent queries to capture zero-click visibility before competitors”
Core Metrics Dashboard Section
The main body of numbers organized by category. This is your at-a-glance performance snapshot.
| Metric Name | Current Period | Previous Period | Change % | Trend Direction | Target |
|---|---|---|---|---|---|
| Revenue Metrics | |||||
| SEO-attributed revenue | $47,200 | $38,600 | +22% | ↑ | $50,000 |
| Revenue per session | $2.14 | $1.89 | +13% | ↑ | $2.25 |
| Organic conversion rate | 3.8% | 3.2% | +19% | ↑ | 4.0% |
| Visibility Metrics | |||||
| Total impressions | 1.24M | 1.18M | +5% | ↑ | 1.3M |
| Impressions in top 3 positions | 342K | 298K | +15% | ↑ | 360K |
| Featured snippet ownership | 28 | 24 | +17% | ↑ | 30 |
| Engagement Metrics | |||||
| Avg scroll depth (key pages) | 68% | 61% | +11% | ↑ | 70% |
| Pages per session | 2.4 | 2.2 | +9% | ↑ | 2.5 |
| Return visitor rate | 41% | 38% | +8% | ↑ | 45% |
| Technical Metrics | |||||
| Core Web Vitals pass rate | 87% | 82% | +6% | ↑ | 90% |
| Index coverage ratio | 94% | 96% | -2% | ↓ | 98% |
| Structured data validation | 96% | 94% | +2% | ↑ | 98% |
Segment Performance Section
Breaking down performance by page type or user segment reveals what’s working and where to double down.
Segment dimensions to report on:
- Performance by landing page category — Product pages converting at 5.2%, blog posts at 1.8%, comparison pages at 6.4%—invest more in comparison content
- Performance by device type — Desktop revenue per session 2x mobile; mobile bounce rate 12 points higher—mobile UX needs work
- Branded vs non-branded traffic — Non-branded impressions up 18% MoM while branded flat—market-expansion strategy working
- New vs returning visitor metrics — Returning visitors convert at 4.3x the rate of new visitors; focus on content that drives repeat traffic
- Geographic performance for multi-location businesses — West Coast region seeing 34% higher conversion rates than Midwest; adjust content localization
Competitive Comparison Section
Market position and share of voice provide context for your performance. Growing impressions means nothing if competitors are growing faster.
Competitive metrics to track:
- Share of voice for target keywords — You own 23% impression share for core product queries vs Competitor A (31%) and Competitor B (19%)
- AI Overview citation rate vs competitors — Your content cited in 14% of AI Overviews for target queries; Competitor A cited in 22%
- Featured snippet ownership comparison — You own 28 featured snippets; Competitor A owns 41; Competitor B owns 19
- Organic visibility trend vs top 3 competitors — Your visibility up 12% over 6 months; Competitor A up 18%; Competitor B flat
Action Items and Recommendations Section
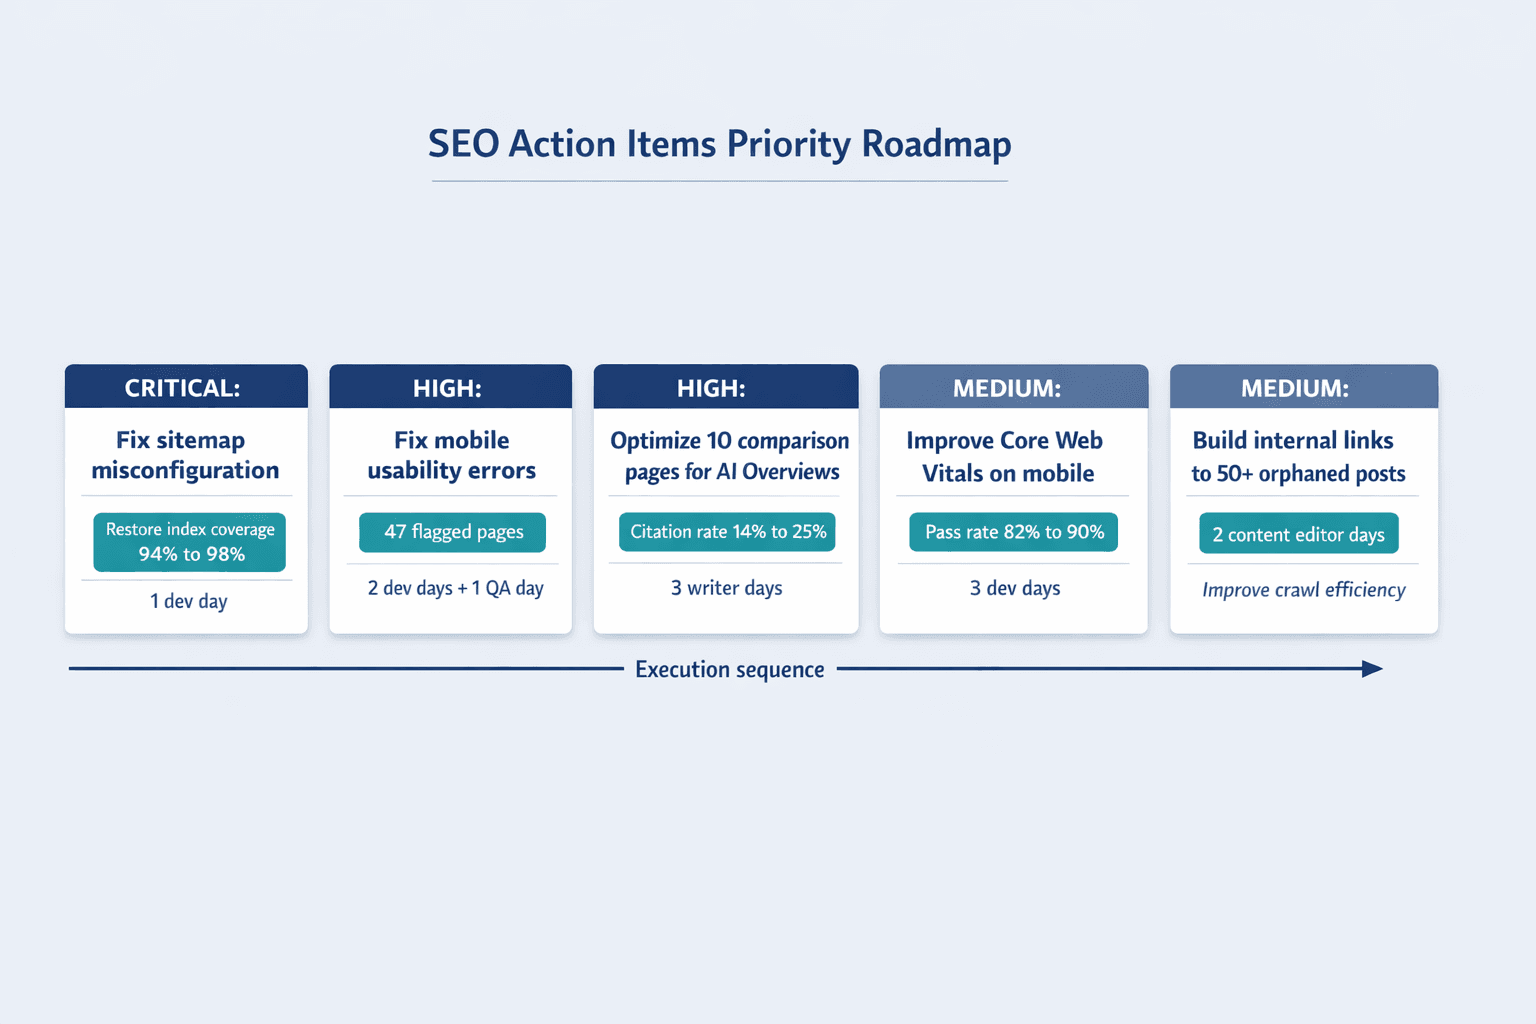
This is the forward-looking component that turns data into decisions. Every recommendation includes action, impact, effort, priority, and owner.
Recommendation format:
- Fix mobile usability errors on product pages (HIGH PRIORITY)
- Action: Audit 47 flagged pages for tap target size and viewport issues; implement fixes by end of month
- Expected impact: Improve mobile conversion rate by estimated 8-12% based on similar past fixes
- Resources required: 2 developer days + 1 QA day
- Owner: Dev team lead
- Optimize top 10 comparison pages for AI Overview inclusion (HIGH PRIORITY)
- Action: Restructure intro paragraphs to answer comparison queries directly in first 2-3 sentences; add structured comparison tables
- Expected impact: Increase AI Overview citation rate for comparison queries from 14% to target 25%
- Resources required: 3 content writer days
- Owner: Content marketing manager
- Address index coverage drop caused by sitemap misconfiguration (CRITICAL)
- Action: Fix sitemap generation script excluding recent blog posts; resubmit corrected sitemap; monitor index coverage report weekly
- Expected impact: Restore index coverage ratio from 94% to 98% within 2 weeks
- Resources required: 1 dev day
- Owner: Technical SEO lead
- Improve Core Web Vitals on mobile (MEDIUM PRIORITY)
- Action: Optimize hero images and implement lazy loading on blog template
- Expected impact: Increase mobile Core Web Vitals pass rate from 82% to target 90%
- Resources required: 3 dev days
- Owner: Front-end engineer
- Build internal link network to orphaned blog posts (MEDIUM PRIORITY)
- Action: Add contextual internal links from top 20 high-traffic pages to 50+ orphaned posts
- Expected impact: Improve crawl efficiency and blog post impression volume
- Resources required: 2 content editor days
- Owner: Content operations
Appendix Section
Supporting details for those who want to dig deeper. Most stakeholders won’t read this—it’s for the SEO team and anyone troubleshooting specific issues.
Appendix elements to include:
- Full keyword ranking list — Export top 500 keywords with position, impressions, clicks, CTR
- Complete backlink acquisition log — New referring domains this period, lost domains, net gain
- Technical issue details — Full list of mobile usability errors, structured data validation failures, crawl anomalies
- Algorithm update timeline — Dates and descriptions of known Google updates during reporting period
- Methodology notes for custom metrics — Document how you calculate custom KPIs like revenue attribution model, share of voice formula, engagement scoring
Tools for Creating SEO KPI Reports
The reporting tool landscape ranges from free native platforms to enterprise business intelligence solutions. Most teams need a combination: GA4 for conversion tracking, Search Console for visibility, and either Looker Studio or a spreadsheet for blended dashboards.
Analytics and Data Collection Tools
Essential tools and their specific use cases:
- Google Analytics 4 for conversion tracking — GA4’s channel grouping now explicitly includes AI Overviews and AI Mode in Organic Search, making it the primary source for revenue attribution and conversion measurement
- Google Search Console for visibility metrics — Performance reports provide clicks, impressions, CTR, and average position across Search, News, and Discover—first-party data you can’t get elsewhere
- SEO platforms for competitive data — Ahrefs, SEMrush, and Moz provide backlink analysis, rank tracking, and competitive share of voice metrics Search Console doesn’t cover
- Crawling tools for technical metrics — Screaming Frog and Sitebulb identify technical issues at scale—broken links, orphaned pages, indexation problems
- Rank tracking tools for position monitoring — While average position is approximate, dedicated rank trackers offer more granular visibility and local rank tracking
Visualization and Reporting Platforms
Reporting platforms with pros and cons:
- Google Looker Studio for free automated dashboards — Official connectors for Analytics and Search Console enable blended dashboards with no cost; learning curve for advanced visuals
- Tableau for enterprise visualization — Powerful custom dashboards and data blending; expensive and overkill for small teams
- Excel/Google Sheets for customizable templates — Maximum flexibility; requires manual updates unless you build API integrations
- Agency Analytics/DashThis for client reporting — White-label reporting with pre-built SEO templates; subscription cost adds up; limited customization
- PowerBI for integrated business intelligence — Connects to broader company data for holistic reporting; requires Microsoft ecosystem and technical setup
Common SEO KPI Reporting Mistakes
These pitfalls reduce report effectiveness. Stakeholders ignore reports that overwhelm with data, lack historical context, or fail to provide clear next steps.
Mistake 1: Reporting Too Many Metrics
Overwhelming stakeholders with 30 metrics reduces decision-making rather than improving it. Every number competes for attention; too many and nothing stands out.
Guidelines for metric selection:
- Maximum 10-12 metrics per report — Curate ruthlessly; if it doesn’t influence a decision, cut it
- Every metric must have a clear owner and action threshold — If organic revenue drops below $40K, content team prioritizes conversion optimization
- Remove any metric that hasn’t influenced a decision in 3 months — If you’ve tracked domain authority for a quarter and never acted on it, stop tracking it
Mistake 2: Lacking Historical Context
Point-in-time numbers mean nothing without trends. “42,000 impressions this month” tells you nothing unless you know it’s up 15% from last month and 22% from last year.
Context requirements:
- Always show minimum 3-month trend — Search Console supports date comparisons natively—use them
- Annotate major events that affected metrics — Algorithm updates, site migrations, campaign launches, seasonal spikes
- Compare to same period last year for seasonal businesses — Retail, travel, education all have strong seasonal patterns—MoM alone misleads
Mistake 3: Ignoring Seasonality
Seasonal businesses get misinterpreted without year-over-year comparisons. December organic revenue up 8% sounds great until you realize last December was up 22%—you’re actually losing ground.
Seasonality adjustments:
- Year-over-year comparison as default — Always include YoY change alongside MoM change
- Seasonal baseline benchmarks — Document typical Q4 vs Q1 performance to set realistic expectations
- Adjusted targets for high/low seasons — Don’t set flat monthly revenue targets if your business has 3x summer volume vs winter
Mistake 4: No Clear Action Items
Reports without recommendations waste stakeholder time. They show problems but don’t propose solutions.
Action item requirements:
- Every underperforming metric gets a specific recommendation — Index coverage dropped 8%? Recommendation: Fix sitemap generation bug by Friday
- Recommendations include estimated impact and effort — “Optimize top 10 product pages for featured snippets—estimated 12% impression lift, 4 content writer days”
- Priority ranking guides resource allocation — Label recommendations HIGH/MEDIUM/LOW based on impact and urgency so teams know what to tackle first
FAQ: SEO KPI Report
How often should I create an SEO KPI report?
Monthly reporting is standard for executive updates, with weekly cadence for active campaigns and quarterly reviews for strategic planning.
Increase frequency during high-volatility periods: new site launches, algorithm update windows, or seasonal peaks. Decrease during stable periods where metrics move slowly. GA4 scheduled reports make monthly distribution effortless once you build the report template.
What's the difference between an SEO KPI report and an analytics report?
KPI reports track specific business goals—revenue, leads, market share—while analytics reports show all available data without curation or business context.
Search Console performance reports focus on a narrow set of search visibility metrics (clicks, impressions, CTR, position). That’s closer to a KPI report. A full GA4 property export with 50+ metrics and no filtering? That’s an analytics report. KPI reports are designed for decision-making; analytics reports are designed for exploration.
Which SEO metrics should executives care about?
Executives care about revenue, market share, and ROI metrics. Lead with SEO-attributed revenue, customer acquisition cost from organic, and competitive visibility trends.
Translate SEO outcomes into business language. Instead of “organic impressions up 18%,” say “market visibility expanded 18% while maintaining cost efficiency—organic CAC remains 40% lower than paid channels.” GA4’s attribution modeling helps tie key events and revenue back to Organic Search at event, session, and user scope.
How do I prove SEO ROI in my KPI report?
Set up revenue attribution in GA4 to tie conversions and dollar values back to Organic Search. Calculate customer acquisition cost (SEO investment ÷ new customers from organic) and compare to paid channel CAC.
Include assisted conversions—multi-touch attribution where organic played a role but wasn’t the last click. Track lifetime value of organic users by cohort to show long-term impact. Be transparent about attribution limitations—conversion timing and model changes can materially affect reported outcomes.
Should my SEO KPI report include competitor data?
Yes—competitive context is essential for understanding market position. Growing impressions 10% means nothing if your top competitor grew 25%.
Track share of voice for target keywords, AI Overview citation rates vs competitors, and featured snippet ownership comparison. Search Console supports segmentation for internal performance breakdowns, but competitor metrics require external SEO platforms like Ahrefs or SEMrush. Include 2-3 top competitors in every report—enough for context without overwhelming the narrative.