Variance Analysis: How to Explain What Changed and Why
Variance analysis compares budgeted vs actual results to spot problems early and control costs. Learn how to calculate variances, investigate causes, and use insights to improve budgets.
Quick Verdict
Variance analysis is the process of examining differences between planned and actual financial results to understand what changed and why. It’s a systematic comparison of budgeted numbers against what actually happened—and then figuring out the reasons behind those differences.
Here’s why it matters: businesses set budgets to guide spending, allocate resources, and measure performance. But reality rarely matches the plan perfectly. Variance analysis helps you spot problems early (like costs spiraling out of control), identify opportunities (like unexpected revenue growth), and make better decisions by understanding what’s driving the differences. It’s how finance teams move from simply recording numbers to actually controlling them.
This guide covers the fundamentals of variance analysis—how it works in accounting contexts, which variances matter most, and how businesses use these insights to improve budgets, control costs, and respond to changing conditions.
What Is Variance Analysis
Variance analysis is a quantitative investigation of the difference between planned and actual behavior. It’s used to maintain control over business operations by comparing what you expected to happen with what actually happened.
When actual results differ from budgeted or standard results, variance analysis investigates the reasons behind those differences. Instead of just noting that materials cost $8,000 more than planned, you dig into whether that’s because prices went up, you used more materials than expected, or both.
Key components of variance analysis:
- Favorable vs unfavorable variances — Whether the difference helps or hurts financial performance (context matters: higher costs are unfavorable, higher revenue is favorable)
- Standard costs vs actual costs — The predetermined benchmark you’re measuring against versus what you actually spent
- The variance formula — The basic calculation that shows the size of the difference
- Materiality thresholds — Rules for which variances are significant enough to investigate
- Root cause investigation — The detective work to understand why the variance happened
The Purpose of Variance Analysis
Businesses perform variance analysis to improve financial control, identify operational inefficiencies, and support strategic decision-making. It transforms budget monitoring from passive record-keeping into active management.
Business benefits of variance analysis:
- Cost control — Catch overruns before they become chronic problems
- Performance evaluation — Measure how well departments and managers are hitting targets
- Budget accuracy improvement — Learn from past variances to create more realistic future budgets
- Early problem detection — Spot issues like rising material costs or declining productivity quickly
- Accountability — Create clear ownership when actual performance deviates from plan
- Resource allocation optimization — Redirect spending based on what’s actually working
Types of Variances Analyzed
Businesses track variances across different categories to understand performance from multiple angles.
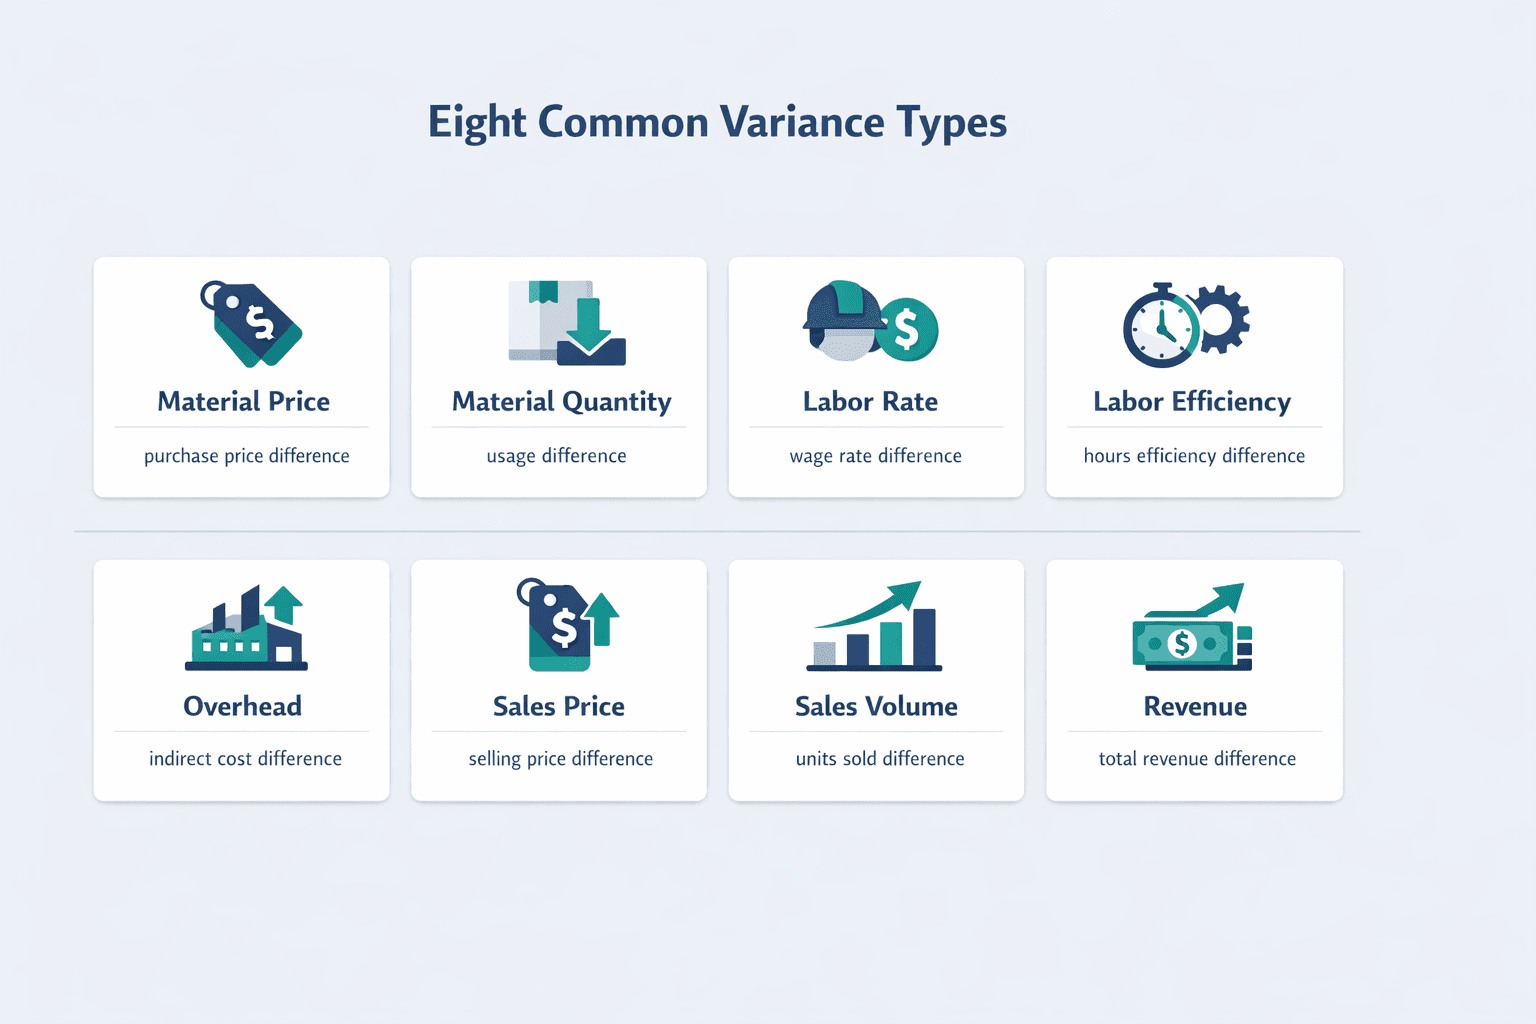
Common variance types:
- Material price variance — Difference between actual and standard purchase prices for materials
- Material quantity variance — Difference between actual material usage and what the standard calls for
- Labor rate variance — Difference between actual wages paid and standard wage rates
- Labor efficiency variance — Difference between actual hours worked and standard hours for the output produced
- Overhead variance — Difference between actual overhead costs and applied overhead
- Sales price variance — Difference between actual selling price and budgeted price
- Sales volume variance — Difference between actual units sold and budgeted units
- Revenue variance — Total difference between actual and budgeted revenue from all causes
Variance Analysis Accounting
In accounting systems, variance analysis functions to track and explain deviations from standard costs and budgeted amounts. It’s a management accounting tool focused on internal decision-making rather than external financial reporting.
Accountants use variance analysis differently than traditional financial accounting. Financial accounting reports historical results to investors and regulators. Variance analysis is forward-looking—it’s about identifying issues you can still fix and improving future performance. The detailed variance calculations rarely appear in external financial statements because they’re designed for internal management use.
The Variance Analysis Formula
The basic variance calculation is straightforward:
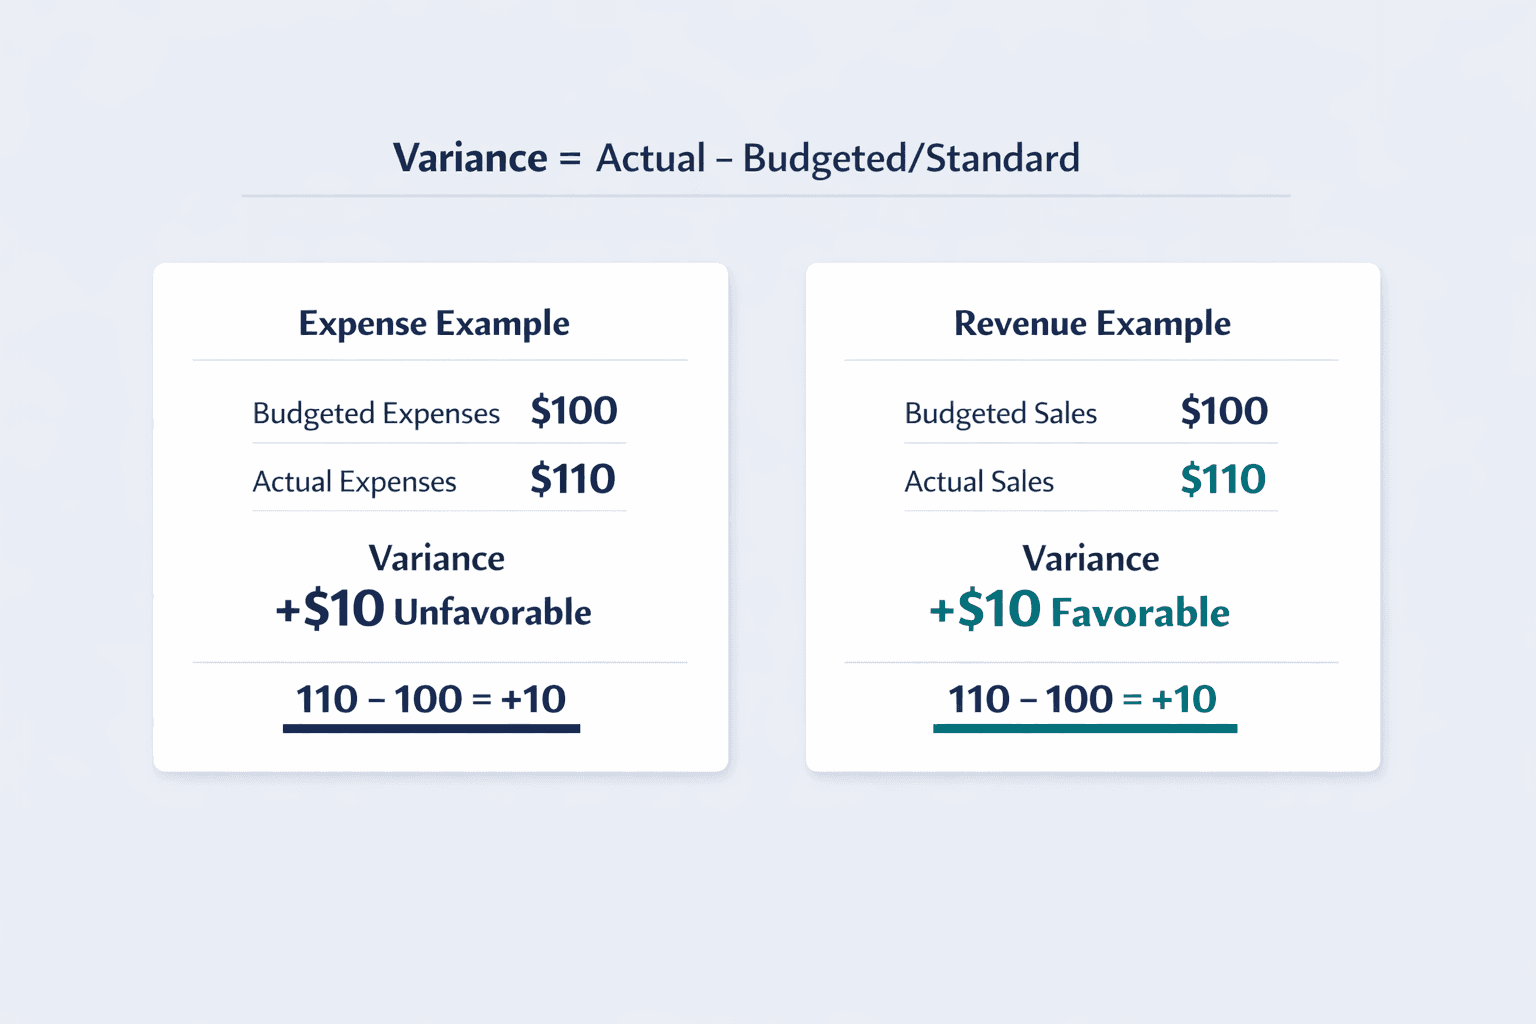
Variance = Actual Amount - Budgeted/Standard Amount
How you interpret the results depends on what you’re measuring. For expenses, a positive variance (actual > budget) is unfavorable because you spent more than planned. For revenue, a positive variance is favorable because you earned more than expected.
Example for expense accounts:
- Budgeted expenses: $100
- Actual expenses: $110
- Variance: +$10 (unfavorable because you overspent)
Example for revenue accounts:
- Budgeted sales: $100
- Actual sales: $110
- Variance: +$10 (favorable because you exceeded the target)
Standard Costing in Variance Analysis
Standard costs are predetermined costs that serve as the benchmark for variance analysis in accounting. They’re what you expect each unit to cost based on efficient operations, current prices, and normal production volumes.
Key points about standard costs:
- How they’re determined — Based on engineering studies, historical data, current supplier quotes, and time-motion analysis of labor
- Types of standards — Ideal standards (perfect conditions, rarely achievable) vs attainable standards (realistic but efficient performance)
- When they’re updated — At least annually, or more often if market conditions shift significantly
- Relationship to budgets — Standards focus on per-unit costs; budgets apply those standards to expected production volumes
Standard costing systems enable detailed variance analysis by providing predetermined costs for materials, labor, and overhead. When you know what a product should cost, you can quickly spot when actual costs deviate—and investigate why.
Recording Variances in Accounting Systems
Variances are captured and recorded in accounting ledgers differently depending on the system. Many companies track variances internally without actually recording them in the general ledger used for external reporting.
Key accounting practices for variances:
- When variances are recorded — Material price variances can be recorded at purchase (when you buy the materials) or at use (when they enter production); labor and overhead variances are typically recorded as incurred
- Favorable variance treatment — May be recorded as a credit to a variance account, reducing cost of goods sold
- Unfavorable variance treatment — Recorded as a debit to a variance account, increasing cost of goods sold
- Period-end disposition — If standards are current and well-researched, variances are recognized in the current period rather than allocated to inventory
Material and Labor Variances
The most common variances analyzed in accounting are those related to direct materials and direct labor. These are the easiest to measure and often the largest cost components in manufacturing.
Material Variances
Material price variance:
- Formula: (Actual price - Standard price) × Actual quantity purchased
- What it measures: Whether you paid more or less than expected per unit of material
- Common causes: Supplier price increases, bulk discounts, emergency purchases, switching vendors
Material quantity variance:
- Formula: (Actual quantity used - Standard quantity for actual output) × Standard price
- What it measures: Whether you used more or less material than the standard calls for
- Common causes: Waste, spoilage, theft, inefficient cutting, equipment problems, worker skill issues
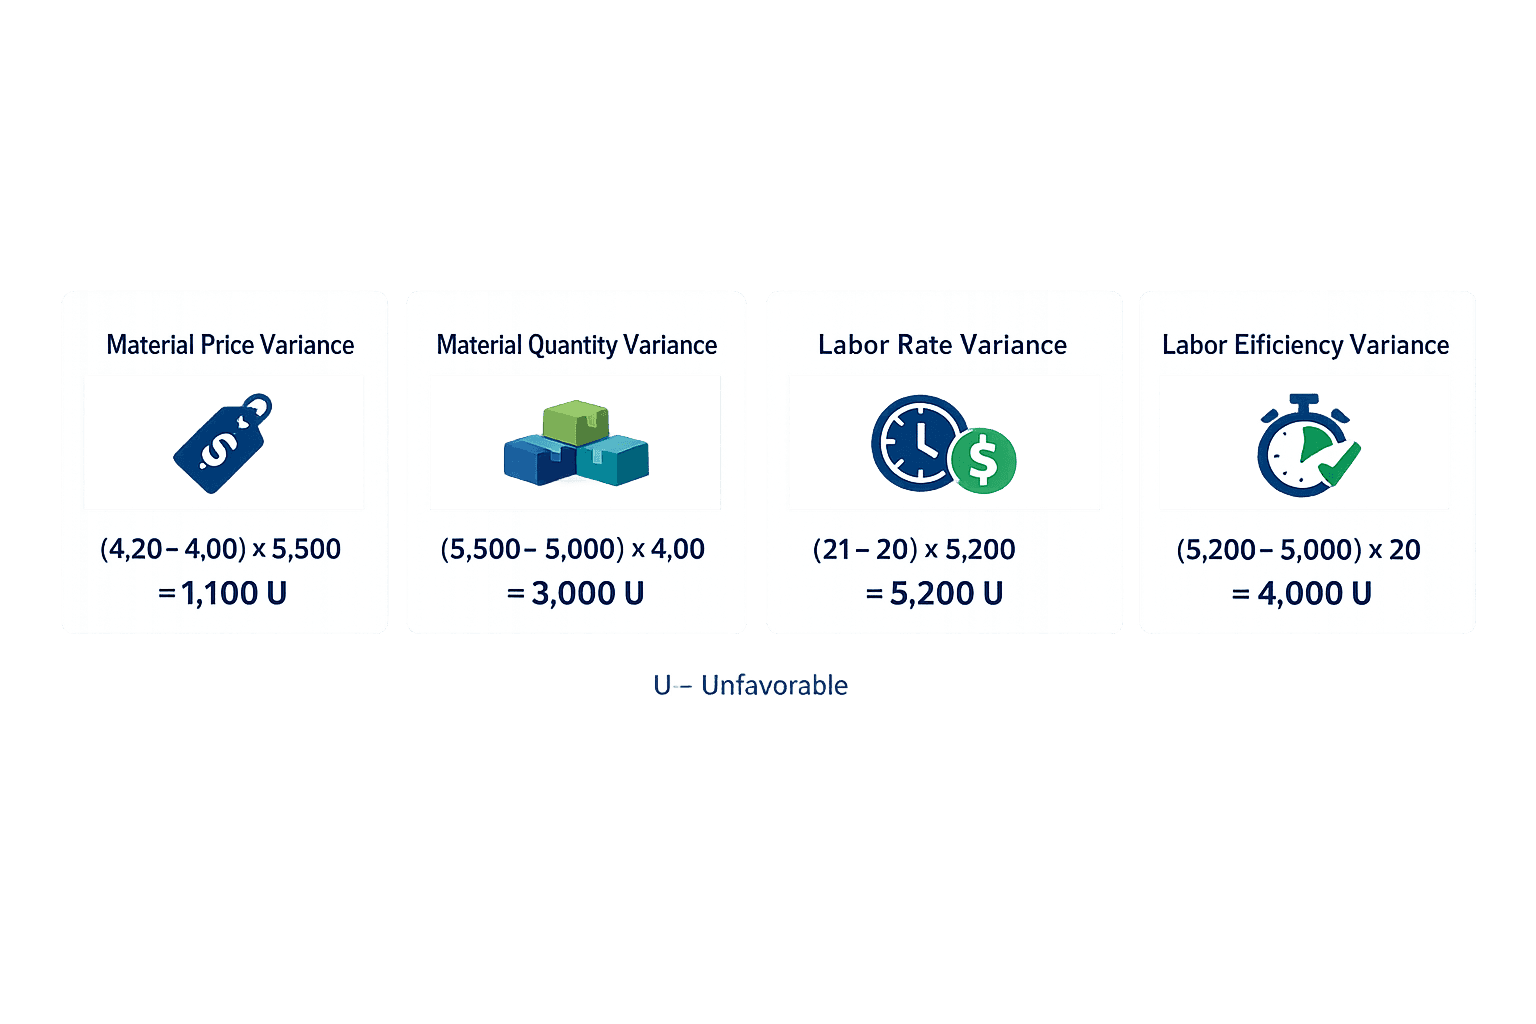
Example: A manufacturer produces 10,000 units. The standard calls for 0.5 pounds of steel per unit at $4 per pound ($20,000 total). They actually use 5,500 pounds and pay $4.20 per pound ($23,100 total).
- Total material variance: $23,100 - $20,000 = $3,100 unfavorable
- Price variance: ($4.20 - $4.00) × 5,500 = $1,100 unfavorable
- Quantity variance: (5,500 - 5,000) × $4.00 = $2,000 unfavorable
Both components are unfavorable—prices were higher and more material was used than planned.
Labor Variances
Labor rate variance:
- Formula: (Actual rate - Standard rate) × Actual hours worked
- What it measures: Whether you paid more or less per hour than budgeted
- Common causes: Overtime premiums, shift differentials, using higher-skilled (more expensive) workers than planned, wage increases
Labor efficiency variance:
- Formula: (Actual hours - Standard hours for actual output) × Standard rate
- What it measures: Whether production took more or fewer hours than the standard allows
- Common causes: Worker experience levels, equipment downtime, process improvements, training gaps, poor scheduling
Example: Standard cost card calls for 0.5 hours per unit at $20/hour. Actual production of 10,000 units took 5,200 hours at an average rate of $21/hour.
- Total labor variance: (5,200 × $21) - (5,000 × $20) = $109,200 - $100,000 = $9,200 unfavorable
- Rate variance: ($21 - $20) × 5,200 = $5,200 unfavorable
- Efficiency variance: (5,200 - 5,000) × $20 = $4,000 unfavorable
Again, both unfavorable—higher wages and longer production time than planned.
Overhead Variances
Overhead variance analysis is more complex than materials or labor because overhead includes both fixed costs (rent, salaries) and variable costs (utilities, supplies). The calculations involve more steps and assumptions.
Types of overhead variances:
- Variable overhead spending variance — Difference between actual variable overhead costs and what should have been spent given actual activity levels
- Variable overhead efficiency variance — Difference in overhead costs caused by using more or fewer activity hours than standard
- Fixed overhead budget variance — Difference between actual fixed overhead and budgeted fixed overhead
- Fixed overhead volume variance — The difference between budgeted fixed overhead and the amount applied to production based on standard costs
For smaller businesses, detailed overhead variance analysis may not be worth the effort—the insights often don’t justify the calculation complexity.
Variance Analysis Report
A variance analysis report is a formal document that presents variances, their causes, and recommended actions in a structured format for management review. It’s how finance teams communicate what went wrong (or right) and what should be done about it.
Key Components of a Variance Analysis Report
An effective variance analysis report combines data, context, and action.
Essential report elements:
- Executive summary — One-paragraph overview of the biggest variances and key takeaways
- Variance summary table — High-level view showing all significant variances with dollar amounts and percentages
- Detailed variance calculations — The math behind each major variance, broken into components where helpful
- Variance explanations/root causes — Why each variance happened based on investigation
- Trend analysis — Whether the variance is one-time or part of a pattern over multiple periods
- Responsibility assignment — Which manager or department owns the variance
- Corrective action recommendations — Specific steps to address unfavorable variances or capitalize on favorable ones
- Supporting documentation — Links to invoices, production reports, or other evidence
How to Create a Variance Analysis Report
Building a comprehensive variance report follows a logical sequence.
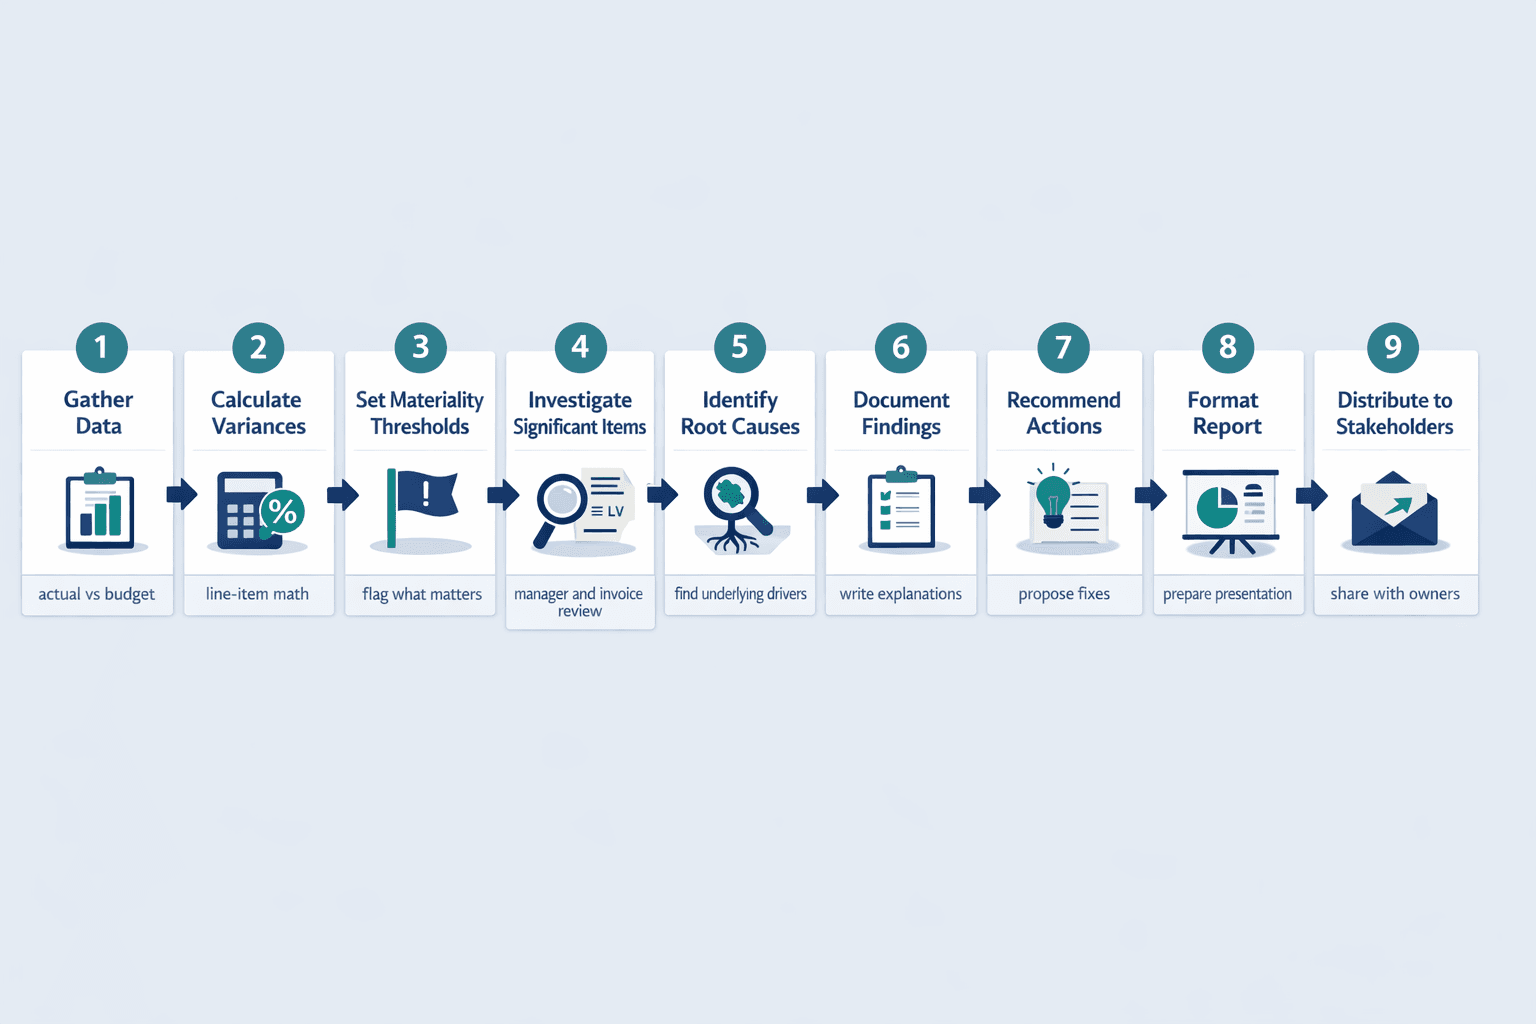
Step-by-step process:
- Gather actual vs budgeted data — Pull financial results from your accounting system and the corresponding budget figures
- Calculate all variances — Apply the variance formula to every line item you’re tracking
- Determine materiality thresholds — Decide which variances are significant enough to investigate (more on this below)
- Investigate significant variances — Talk to department managers, review transactions, check supplier invoices
- Identify root causes — Move beyond symptoms (“labor costs were high”) to actual causes (“two senior technicians left and we hired overtime replacements”)
- Document findings — Write clear explanations for each material variance
- Recommend corrective actions — Propose specific steps management can take
- Format for management presentation — Structure the report for easy scanning with clear headings and visual highlights
- Distribute to stakeholders — Send to department heads, executives, and anyone responsible for acting on findings
Variance Report Format and Best Practices
Structure variance reports for maximum clarity and usability.
Best practices:
- Use clear headings and sections — Make it easy to jump to specific variances
- Include both dollar and percentage variances — Absolute numbers show scale; percentages show relative importance
- Highlight material variances visually — Use color coding or bold text to draw attention to significant items
- Separate favorable and unfavorable variances — Don’t mix them together in the same summary
- Include period-over-period comparisons — Show whether variances are improving or getting worse
- Use tables and charts — Visual presentation is faster to digest than paragraphs of numbers
- Focus on actionable insights — Don’t report variances you can’t do anything about
Sample variance report table structure:
| Account/Category | Budget | Actual | Variance ($) | Variance (%) | Status |
|---|---|---|---|---|---|
| Direct Materials | $50,000 | $53,200 | $3,200 | 6.4% | Unfavorable |
| Direct Labor | $80,000 | $79,100 | ($900) | (1.1%) | Favorable |
| Manufacturing Overhead | $35,000 | $36,800 | $1,800 | 5.1% | Unfavorable |
| Sales Revenue | $200,000 | $215,000 | $15,000 | 7.5% | Favorable |
Frequency and Distribution of Variance Reports
How often you generate variance analysis reports depends on how quickly you need to respond to problems.
Timing considerations:
- Monthly reports for operational control — Most businesses run full variance analysis monthly to catch issues while they’re still fixable
- Quarterly reports for strategic review — High-level variance summaries for board meetings and strategic planning sessions
- Real-time dashboards for critical metrics — Some companies track key variances in live dashboards between formal monthly reports
- Annual comprehensive analysis — Year-end variance analysis feeds into next year’s budgeting process
Conducting Effective Variance Analysis
The practical process of performing variance analysis goes beyond just the calculations. It’s a workflow that starts with numbers and ends with management action.
The Variance Analysis Process
The complete variance analysis workflow:
- Set standards/budgets — Establish the benchmarks you’ll compare actual results against
- Collect actual data — Pull real results from your accounting system, production reports, and sales data
- Calculate variances — Apply the variance formula to identify all differences
- Filter for materiality — Focus on variances large enough to matter (see next section)
- Investigate root causes — Dig into why material variances occurred
- Document findings — Write up explanations that management can act on
- Communicate results — Distribute variance reports to stakeholders
- Implement corrective actions — Make changes based on variance insights
- Monitor effectiveness — Track whether your fixes actually resolve the issues
Investigating Variance Causes
Moving from identifying variances to understanding their root causes is where the real value lives. A variance is just a symptom—the cause is what you need to fix.
Common variance causes:
- Price changes from suppliers — Raw material costs, shipping rates, tariffs
- Wage rate changes — Union contracts, overtime, shift differentials, minimum wage increases
- Inefficient operations — Poor process design, equipment breakdowns, bottlenecks
- Equipment problems — Downtime, maintenance issues, outdated machinery
- Quality issues — Defects leading to rework, scrap, or returns
- Volume changes — Producing more or less than planned affects per-unit costs
- Seasonal factors — Predictable fluctuations that weren’t properly budgeted
- Market conditions — Economic changes, competitor actions, demand shifts
- Skill level changes — New workers learning, experienced workers leaving
- Forecasting errors — The original budget was simply wrong
It’s crucial to distinguish between controllable and uncontrollable variances. A price increase from your only supplier is uncontrollable. Excessive scrap from poor training is controllable.
Materiality in Variance Analysis
Not all variances require investigation. Materiality is the concept that only significant variances deserve management attention.
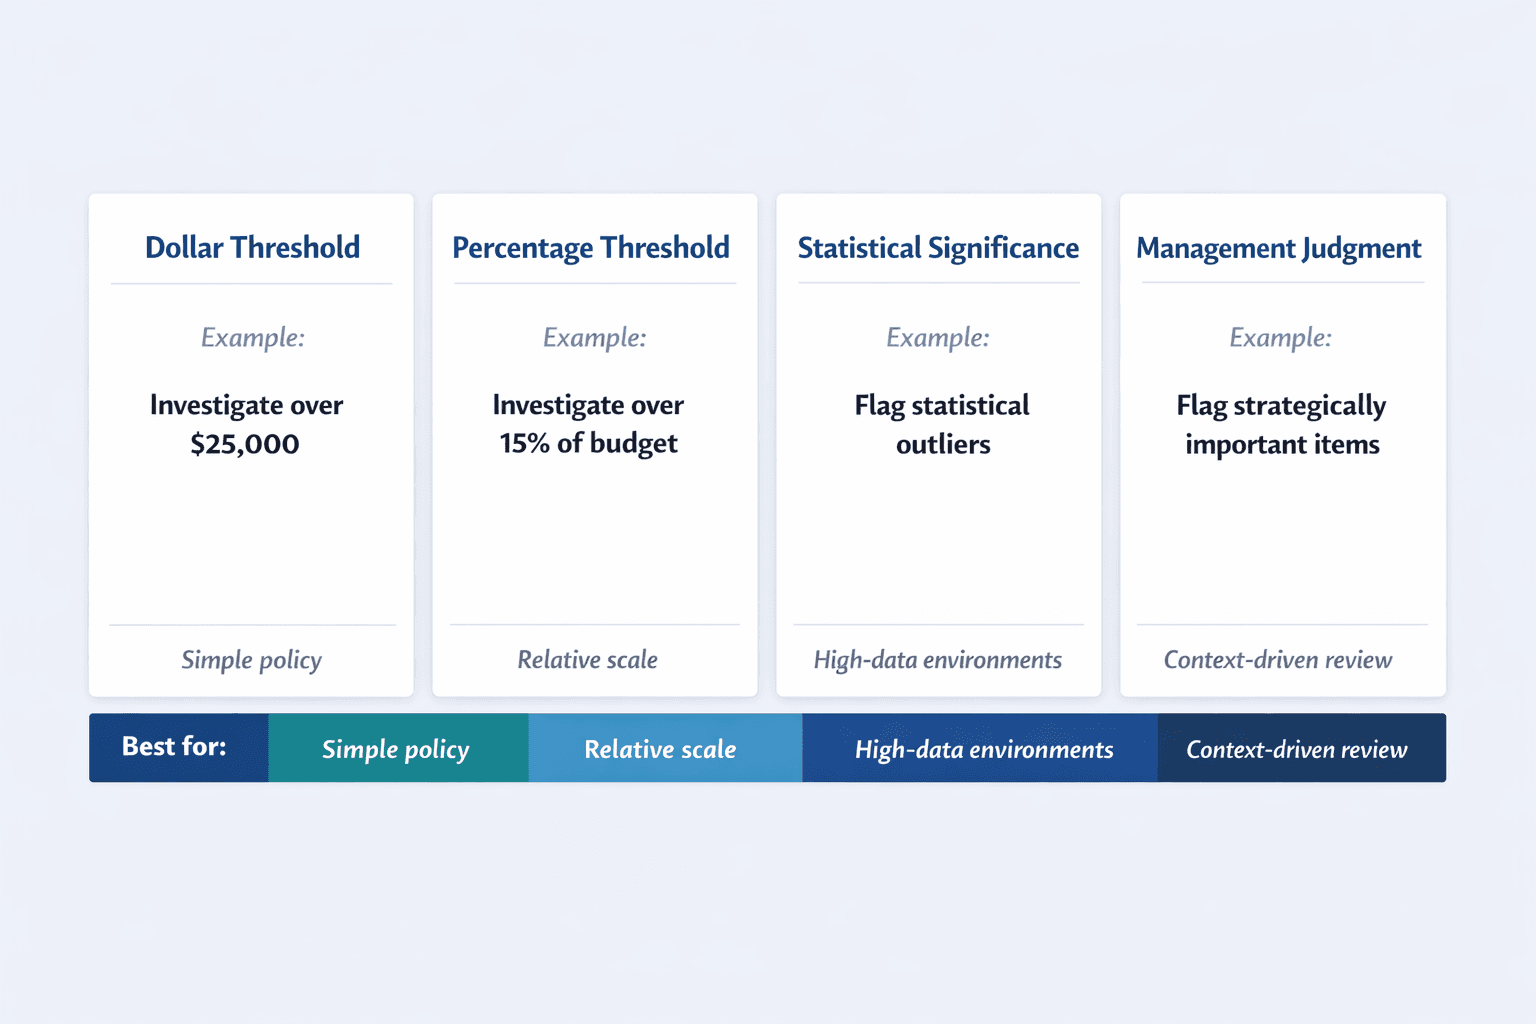
Approaches to determining materiality:
- Dollar threshold — Investigate any variance over $25,000, for example
- Percentage threshold — Investigate variances exceeding 15% of budget
- Statistical significance — Use statistical methods to identify outliers
- Management judgment — Flag variances in strategically important areas even if they’re small
Set appropriate materiality thresholds based on your business context. A $5,000 variance might be immaterial for a $50 million manufacturer but critical for a $500,000 startup.
Using Variance Analysis for Decision-Making
Variance analysis insights translate into management actions. The point isn’t just to explain what happened—it’s to drive better decisions.
Management Actions Based on Variance Analysis
Typical management responses to variance analysis findings:
| Variance Type | Possible Causes | Potential Management Actions |
|---|---|---|
| Unfavorable material price variance | Supplier price increases, emergency purchases | Negotiate with suppliers, find alternative sources, buy in larger quantities, lock in prices with contracts |
| Unfavorable material quantity variance | Waste, spoilage, theft, inefficient processes | Improve quality control, redesign production process, investigate inventory security, retrain workers |
| Unfavorable labor efficiency variance | Low productivity, equipment downtime, skill gaps | Provide training, upgrade equipment, improve scheduling, reassign workers |
| Favorable revenue variance | Higher prices, more units sold | Analyze whether trend is sustainable, consider increasing marketing spend, evaluate capacity constraints |
| Unfavorable sales volume variance | Market decline, competitor actions | Adjust marketing strategy, review pricing, improve product features, cut production plans |
Improving Future Budgets and Standards
Variance analysis creates a feedback loop that improves future planning. Each variance teaches you something about how accurate your assumptions were.
Ways variance analysis improves forecasting:
- Identifying systematic bias — If you consistently over-budget labor costs, you’re being too conservative
- Updating assumptions — Material price variances reveal your supplier cost assumptions are outdated
- Refining estimation methods — Repeated efficiency variances suggest your standard times need adjustment
- Incorporating new market data — Price variances from market shifts feed into next year’s commodity cost assumptions
- Adjusting for seasonal patterns — Volume variances reveal seasonal trends you didn’t account for properly
Limitations and Challenges of Variance Analysis
Variance analysis has important limitations that managers should understand.
Key limitations:
- Time-consuming for complex organizations — Manual effort and fragmented data make variance analysis slow in large companies
- Focuses on past performance — You’re analyzing what already happened, not predicting the future
- Requires accurate standards — Outdated or unrealistic standards produce meaningless variances
- Can create blame culture if misused — Turning variance analysis into a “gotcha” tool damages trust
- May not capture qualitative factors — Numbers miss context like market disruption or strategic pivots
- Interdependencies complicate interpretation — A favorable price variance from buying cheap materials may cause unfavorable quantity variances from higher waste
- External factors beyond control — Economic conditions, weather, pandemics—many causes are uncontrollable
- Aggregation can hide problems — Department-level variances may average out issues at the work-cell or batch level
Balance variance analysis with other management tools and forward-looking analysis. Use it to understand the past and improve the future—not to punish people for things outside their control.
Variance Analysis Tools and Software
Technology can streamline variance analysis significantly.
Technology solutions:
- Excel templates and formulas — Simple, flexible, accessible—good starting point for small businesses
- Dedicated variance analysis software — Specialized tools that automate calculations and visualization
- ERP system variance reporting modules — Systems like Oracle and NetSuite include built-in budget-vs-actual reports
- Business intelligence dashboards — Real-time variance tracking with drill-down capabilities
- Integrated accounting platforms — QuickBooks, Xero, and similar tools offer basic variance reports
- Automated data collection tools — APIs and integrations that pull actual data automatically
Choose tools based on your business size and complexity. A 10-person company can manage with Excel. A 500-person manufacturer needs ERP-level automation.
FAQ
What Is a Variance Analysis Report?
A variance analysis report is a document comparing budgeted to actual results, calculating the differences, and explaining why they occurred. It shows which accounts or categories came in over or under plan, by how much, and what caused the variance.
The report typically includes a summary table of variances with both dollar amounts and percentages, detailed explanations of significant variances, and recommendations for corrective action. Management uses it to identify problems, evaluate performance, and make better resource allocation decisions going forward.
FAQ
What Is a Variance Analysis Report?
A variance analysis report is a document comparing budgeted to actual results, calculating the differences, and explaining why they occurred. It shows which accounts or categories came in over or under plan, by how much, and what caused the variance.
The report typically includes a summary table of variances with both dollar amounts and percentages, detailed explanations of significant variances, and recommendations for corrective action. Management uses it to identify problems, evaluate performance, and make better resource allocation decisions going forward.